

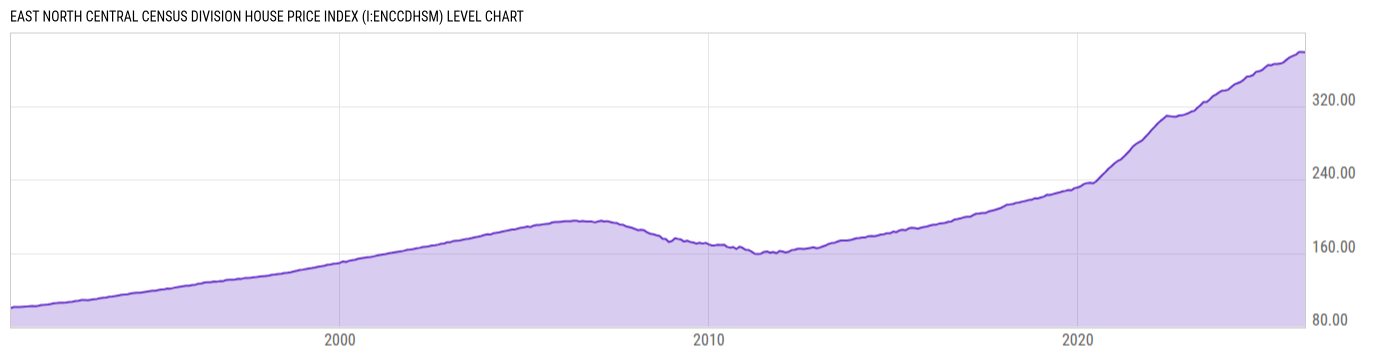
East North Central Census Division House Price Index (I:ENCCDHSM)
382.13 for Mar 2026
Level Chart
Basic Info
|
East North Central Census Division House Price Index is at a current level of 382.13, up from 378.69 last month and up from 363.49 one year ago. This is a change of 0.91% from last month and 5.13% from one year ago. |
| Report | FHFA House Price Index |
| Category | House Prices |
| Region | United States |
| Source | Federal Housing Finance Agency |
Stats
| Last Value | 382.13 |
| Latest Period | Mar 2026 |
| Last Updated | May 26 2026, 09:02 EDT |
| Next Release | Jun 30 2026, 09:00 EDT |
| Average Growth Rate | 3.83% |
| Value from Last Month | 378.69 |
| Change from Last Month | 0.91% |
| Value from 1 Year Ago | 363.49 |
| Change from 1 Year Ago | 5.13% |
| Frequency | Monthly |
| Unit | Index January 1991=100 |
| Adjustment | Seasonally Adjusted |
| Download Source File |
Historical Data
| Date | Value |
|---|---|
| March 31, 2026 | 382.13 |
| February 28, 2026 | 378.69 |
| January 31, 2026 | 378.41 |
| December 31, 2025 | 378.95 |
| November 30, 2025 | 375.87 |
| October 31, 2025 | 374.37 |
| September 30, 2025 | 372.79 |
| August 31, 2025 | 370.16 |
| July 31, 2025 | 367.50 |
| June 30, 2025 | 366.06 |
| May 31, 2025 | 365.36 |
| April 30, 2025 | 365.46 |
| March 31, 2025 | 363.49 |
| February 28, 2025 | 364.76 |
| January 31, 2025 | 362.23 |
| December 31, 2024 | 359.08 |
| November 30, 2024 | 357.38 |
| October 31, 2024 | 357.00 |
| September 30, 2024 | 353.25 |
| August 31, 2024 | 351.99 |
| July 31, 2024 | 351.50 |
| June 30, 2024 | 348.26 |
| May 31, 2024 | 345.84 |
| April 30, 2024 | 344.70 |
| March 31, 2024 | 343.07 |
| Date | Value |
|---|---|
| February 29, 2024 | 340.62 |
| January 31, 2024 | 337.85 |
| December 31, 2023 | 336.96 |
| November 30, 2023 | 336.73 |
| October 31, 2023 | 334.88 |
| September 30, 2023 | 332.42 |
| August 31, 2023 | 330.63 |
| July 31, 2023 | 327.17 |
| June 30, 2023 | 324.41 |
| May 31, 2023 | 324.30 |
| April 30, 2023 | 320.83 |
| March 31, 2023 | 318.15 |
| February 28, 2023 | 314.70 |
| January 31, 2023 | 313.92 |
| December 31, 2022 | 312.14 |
| November 30, 2022 | 310.88 |
| October 31, 2022 | 309.83 |
| September 30, 2022 | 309.65 |
| August 31, 2022 | 308.25 |
| July 31, 2022 | 308.43 |
| June 30, 2022 | 308.97 |
| May 31, 2022 | 309.29 |
| April 30, 2022 | 306.40 |
| March 31, 2022 | 303.82 |
| February 28, 2022 | 300.66 |
News
Headline
Time (ET)
06/03 07:13
05/28 12:00
05/15 07:05
05/14 12:00
05/14 07:24
05/07 12:00
Basic Info
|
East North Central Census Division House Price Index is at a current level of 382.13, up from 378.69 last month and up from 363.49 one year ago. This is a change of 0.91% from last month and 5.13% from one year ago. |
| Report | FHFA House Price Index |
| Category | House Prices |
| Region | United States |
| Source | Federal Housing Finance Agency |
Stats
| Last Value | 382.13 |
| Latest Period | Mar 2026 |
| Last Updated | May 26 2026, 09:02 EDT |
| Next Release | Jun 30 2026, 09:00 EDT |
| Average Growth Rate | 3.83% |
| Value from Last Month | 378.69 |
| Change from Last Month | 0.91% |
| Value from 1 Year Ago | 363.49 |
| Change from 1 Year Ago | 5.13% |
| Frequency | Monthly |
| Unit | Index January 1991=100 |
| Adjustment | Seasonally Adjusted |
| Download Source File |