

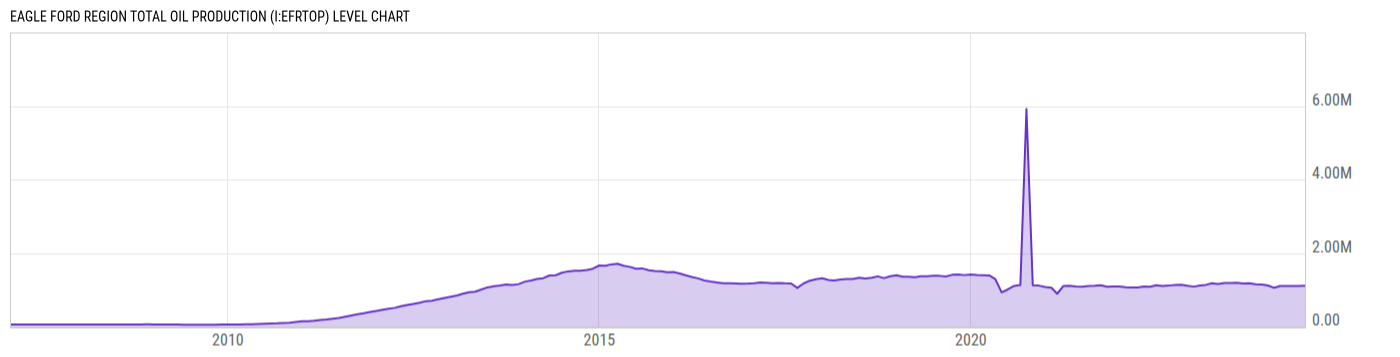
Eagle Ford Region Total Oil Production (I:EFRTOP)
1.106M bbl/d for Jun 2024
Level Chart
Basic Info
|
Eagle Ford Region Total Oil Production is at a current level of 1.106M, up from 1.102M last month and down from 1.186M one year ago. This is a change of 0.35% from last month and -6.75% from one year ago. |
| Report | Drilling Productivity Report |
| Category | Energy |
| Region | N/A |
| Source | Energy Information Administration |
Stats
| Last Value | 1.106M |
| Latest Period | Jun 2024 |
| Last Updated | May 13 2024, 15:31 EDT |
| Next Release | Aug 11 2026, 15:30 EDT |
| Average Growth Rate | 38.80% |
| Value from Last Month | 1.102M |
| Change from Last Month | 0.35% |
| Value from 1 Year Ago | 1.186M |
| Change from 1 Year Ago | -6.75% |
| Frequency | Monthly |
| Unit | Barrels per Day |
| Adjustment | N/A |
| Download Source File |
Historical Data
| Date | Value |
|---|---|
| June 30, 2024 | 1.106M |
| May 31, 2024 | 1.102M |
| April 30, 2024 | 1.100M |
| March 31, 2024 | 1.102M |
| February 29, 2024 | 1.102M |
| January 31, 2024 | 1.053M |
| December 31, 2023 | 1.115M |
| November 30, 2023 | 1.142M |
| October 31, 2023 | 1.152M |
| September 30, 2023 | 1.176M |
| August 31, 2023 | 1.167M |
| July 31, 2023 | 1.190M |
| June 30, 2023 | 1.186M |
| May 31, 2023 | 1.185M |
| April 30, 2023 | 1.157M |
| March 31, 2023 | 1.178M |
| February 28, 2023 | 1.132M |
| January 31, 2023 | 1.114M |
| December 31, 2022 | 1.085M |
| November 30, 2022 | 1.108M |
| October 31, 2022 | 1.135M |
| September 30, 2022 | 1.132M |
| August 31, 2022 | 1.112M |
| July 31, 2022 | 1.105M |
| June 30, 2022 | 1.120M |
| Date | Value |
|---|---|
| May 31, 2022 | 1.082M |
| April 30, 2022 | 1.088M |
| March 31, 2022 | 1.060M |
| February 28, 2022 | 1.061M |
| January 31, 2022 | 1.071M |
| December 31, 2021 | 1.091M |
| November 30, 2021 | 1.090M |
| October 31, 2021 | 1.084M |
| September 30, 2021 | 1.121M |
| August 31, 2021 | 1.107M |
| July 31, 2021 | 1.101M |
| June 30, 2021 | 1.083M |
| May 31, 2021 | 1.088M |
| April 30, 2021 | 1.108M |
| March 31, 2021 | 1.104M |
| February 28, 2021 | 891081.3 |
| January 31, 2021 | 1.054M |
| December 31, 2020 | 1.076M |
| November 30, 2020 | 1.112M |
| October 31, 2020 | 1.120M |
| September 30, 2020 | 5.920M |
| August 31, 2020 | 1.128M |
| July 31, 2020 | 1.102M |
| June 30, 2020 | 1.008M |
| May 31, 2020 | 930291.2 |
News
Headline
Time (ET)
07/27 06:30
07/24 09:26
07/15 07:10
Basic Info
|
Eagle Ford Region Total Oil Production is at a current level of 1.106M, up from 1.102M last month and down from 1.186M one year ago. This is a change of 0.35% from last month and -6.75% from one year ago. |
| Report | Drilling Productivity Report |
| Category | Energy |
| Region | N/A |
| Source | Energy Information Administration |
Stats
| Last Value | 1.106M |
| Latest Period | Jun 2024 |
| Last Updated | May 13 2024, 15:31 EDT |
| Next Release | Aug 11 2026, 15:30 EDT |
| Average Growth Rate | 38.80% |
| Value from Last Month | 1.102M |
| Change from Last Month | 0.35% |
| Value from 1 Year Ago | 1.186M |
| Change from 1 Year Ago | -6.75% |
| Frequency | Monthly |
| Unit | Barrels per Day |
| Adjustment | N/A |
| Download Source File |