

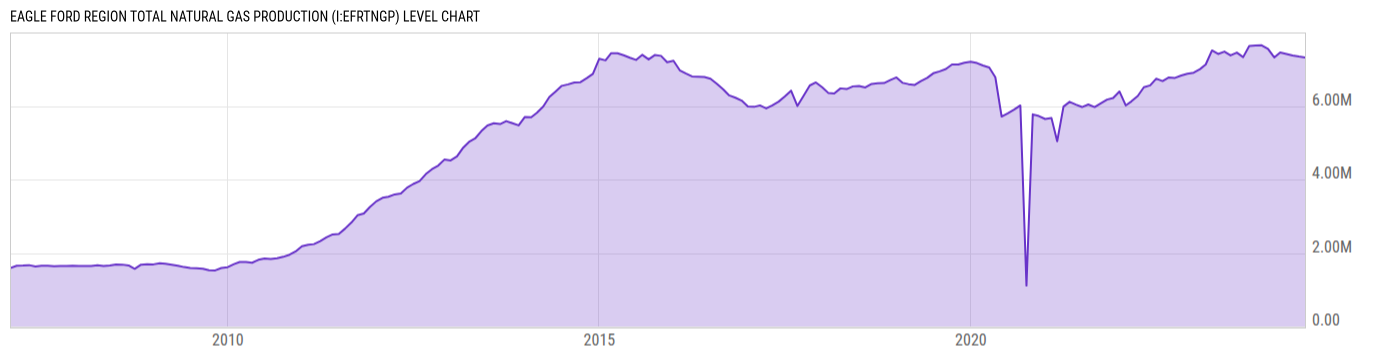
Eagle Ford Region Total Natural Gas Production (I:EFRTNGP)
7.323M cf/d for Jun 2024
Level Chart
Basic Info
|
Eagle Ford Region Total Natural Gas Production is at a current level of 7.323M, down from 7.344M last month and down from 7.375M one year ago. This is a change of -0.29% from last month and -0.72% from one year ago. |
| Report | Drilling Productivity Report |
| Category | Energy |
| Region | N/A |
| Source | Energy Information Administration |
Stats
| Last Value | 7.323M |
| Latest Period | Jun 2024 |
| Last Updated | May 13 2024, 15:32 EDT |
| Next Release | Jun 9 2026, 15:30 EDT |
| Average Growth Rate | 28.89% |
| Value from Last Month | 7.344M |
| Change from Last Month | -0.29% |
| Value from 1 Year Ago | 7.375M |
| Change from 1 Year Ago | -0.72% |
| Frequency | Monthly |
| Unit | Cubic Feet per Day |
| Adjustment | N/A |
| Download Source File |
Historical Data
| Date | Value |
|---|---|
| June 30, 2024 | 7.323M |
| May 31, 2024 | 7.344M |
| April 30, 2024 | 7.373M |
| March 31, 2024 | 7.417M |
| February 29, 2024 | 7.458M |
| January 31, 2024 | 7.322M |
| December 31, 2023 | 7.555M |
| November 30, 2023 | 7.651M |
| October 31, 2023 | 7.645M |
| September 30, 2023 | 7.632M |
| August 31, 2023 | 7.330M |
| July 31, 2023 | 7.452M |
| June 30, 2023 | 7.375M |
| May 31, 2023 | 7.480M |
| April 30, 2023 | 7.415M |
| March 31, 2023 | 7.511M |
| February 28, 2023 | 7.130M |
| January 31, 2023 | 7.003M |
| December 31, 2022 | 6.908M |
| November 30, 2022 | 6.879M |
| October 31, 2022 | 6.830M |
| September 30, 2022 | 6.765M |
| August 31, 2022 | 6.779M |
| July 31, 2022 | 6.679M |
| June 30, 2022 | 6.744M |
| Date | Value |
|---|---|
| May 31, 2022 | 6.562M |
| April 30, 2022 | 6.509M |
| March 31, 2022 | 6.271M |
| February 28, 2022 | 6.127M |
| January 31, 2022 | 6.015M |
| December 31, 2021 | 6.396M |
| November 30, 2021 | 6.218M |
| October 31, 2021 | 6.173M |
| September 30, 2021 | 6.071M |
| August 31, 2021 | 5.970M |
| July 31, 2021 | 6.040M |
| June 30, 2021 | 5.971M |
| May 31, 2021 | 6.037M |
| April 30, 2021 | 6.112M |
| March 31, 2021 | 5.982M |
| February 28, 2021 | 5.039M |
| January 31, 2021 | 5.670M |
| December 31, 2020 | 5.647M |
| November 30, 2020 | 5.727M |
| October 31, 2020 | 5.772M |
| September 30, 2020 | 1.112M |
| August 31, 2020 | 6.015M |
| July 31, 2020 | 5.902M |
| June 30, 2020 | 5.802M |
| May 31, 2020 | 5.711M |
News
Headline
Time (ET)
Basic Info
|
Eagle Ford Region Total Natural Gas Production is at a current level of 7.323M, down from 7.344M last month and down from 7.375M one year ago. This is a change of -0.29% from last month and -0.72% from one year ago. |
| Report | Drilling Productivity Report |
| Category | Energy |
| Region | N/A |
| Source | Energy Information Administration |
Stats
| Last Value | 7.323M |
| Latest Period | Jun 2024 |
| Last Updated | May 13 2024, 15:32 EDT |
| Next Release | Jun 9 2026, 15:30 EDT |
| Average Growth Rate | 28.89% |
| Value from Last Month | 7.344M |
| Change from Last Month | -0.29% |
| Value from 1 Year Ago | 7.375M |
| Change from 1 Year Ago | -0.72% |
| Frequency | Monthly |
| Unit | Cubic Feet per Day |
| Adjustment | N/A |
| Download Source File |