

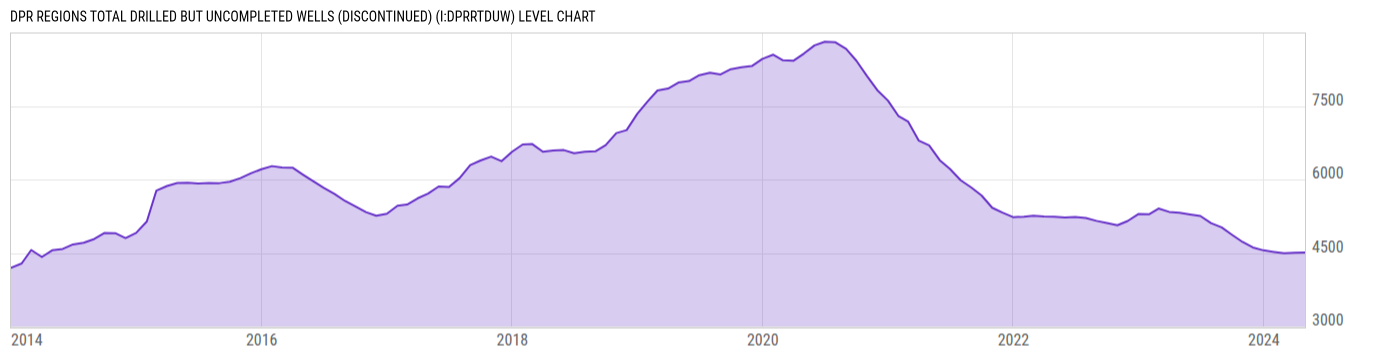
DPR Regions Total Drilled but Uncompleted Wells (DISCONTINUED) (I:DPRRTDUW)
4510 for Apr 2024
Level Chart
Basic Info
|
DPR Regions Total Drilled but Uncompleted Wells is at a current level of 4510, up from 4504 last month and down from 5323 one year ago. This is a change of 0.13% from last month and -15.27% from one year ago. |
| Report | Drilling Productivity Report |
| Category | Energy |
| Region | N/A |
| Source | Energy Information Administration |
Stats
| Last Value | 4510 |
| Latest Period | Apr 2024 |
| Last Updated | May 13 2024, 15:32 EDT |
| Average Growth Rate | 1.03% |
| Value from Last Month | 4504 |
| Change from Last Month | 0.13% |
| Value from 1 Year Ago | 5323 |
| Change from 1 Year Ago | -15.27% |
| Frequency | Monthly |
| Adjustment | N/A |
| Download Source File | |
| Notes | All 7 Drilling Productivity Report Regions |
Historical Data
| Date | Value |
|---|---|
| April 30, 2024 | 4510 |
| March 31, 2024 | 4504 |
| February 29, 2024 | 4494 |
| January 31, 2024 | 4521 |
| December 31, 2023 | 4554 |
| November 30, 2023 | 4613 |
| October 31, 2023 | 4725 |
| September 30, 2023 | 4873 |
| August 31, 2023 | 5023 |
| July 31, 2023 | 5109 |
| June 30, 2023 | 5256 |
| May 31, 2023 | 5288 |
| April 30, 2023 | 5323 |
| March 31, 2023 | 5339 |
| February 28, 2023 | 5407 |
| January 31, 2023 | 5289 |
| December 31, 2022 | 5295 |
| November 30, 2022 | 5153 |
| October 31, 2022 | 5066 |
| September 30, 2022 | 5114 |
| August 31, 2022 | 5156 |
| July 31, 2022 | 5216 |
| June 30, 2022 | 5236 |
| May 31, 2022 | 5225 |
| April 30, 2022 | 5241 |
| Date | Value |
|---|---|
| March 31, 2022 | 5247 |
| February 28, 2022 | 5259 |
| January 31, 2022 | 5241 |
| December 31, 2021 | 5232 |
| November 30, 2021 | 5323 |
| October 31, 2021 | 5423 |
| September 30, 2021 | 5673 |
| August 31, 2021 | 5836 |
| July 31, 2021 | 5985 |
| June 30, 2021 | 6215 |
| May 31, 2021 | 6395 |
| April 30, 2021 | 6698 |
| March 31, 2021 | 6792 |
| February 28, 2021 | 7180 |
| January 31, 2021 | 7291 |
| December 31, 2020 | 7609 |
| November 30, 2020 | 7823 |
| October 31, 2020 | 8111 |
| September 30, 2020 | 8423 |
| August 31, 2020 | 8664 |
| July 31, 2020 | 8799 |
| June 30, 2020 | 8810 |
| May 31, 2020 | 8737 |
| April 30, 2020 | 8570 |
| March 31, 2020 | 8425 |
News
Headline
Time (ET)
Basic Info
|
DPR Regions Total Drilled but Uncompleted Wells is at a current level of 4510, up from 4504 last month and down from 5323 one year ago. This is a change of 0.13% from last month and -15.27% from one year ago. |
| Report | Drilling Productivity Report |
| Category | Energy |
| Region | N/A |
| Source | Energy Information Administration |
Stats
| Last Value | 4510 |
| Latest Period | Apr 2024 |
| Last Updated | May 13 2024, 15:32 EDT |
| Average Growth Rate | 1.03% |
| Value from Last Month | 4504 |
| Change from Last Month | 0.13% |
| Value from 1 Year Ago | 5323 |
| Change from 1 Year Ago | -15.27% |
| Frequency | Monthly |
| Adjustment | N/A |
| Download Source File | |
| Notes | All 7 Drilling Productivity Report Regions |