

Danaher Corp (DHR) - Core Sales Growth (I:DCDHRCNQ)
Level Chart
Basic Info
|
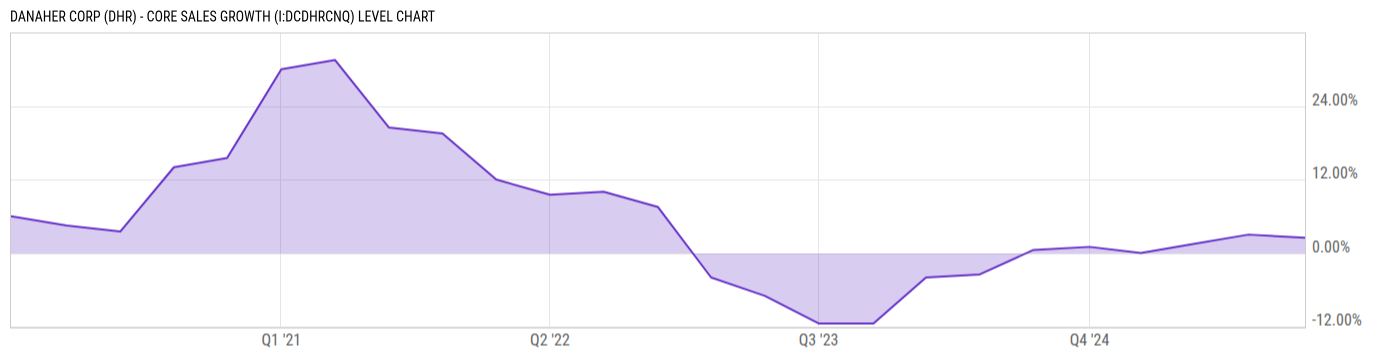
Danaher Corp (DHR) - Core Sales Growth is at 0.50%, compared to 2.50% last quarter and 1.00% last year. This is lower than the long term average of 5.83%. |
|
Danaher Corp Core Sales Growth represents the year-over-year increase in sales or revenues from its existing business segments, excluding the impact of acquisitions, divestitures, or significant currency fluctuations. |
| Report | Fiscal.ai |
| Category | Segments & KPIs |
| Region | United States |
| Source | Fiscal.ai |
|
Data provided via Fiscal.ai |
Stats
| Last Value | 0.50% |
| Latest Period | Mar 2026 |
| Last Updated | May 20 2026, 18:18 EDT |
| Next Release | Jul 15 2026, 08:30 EDT (E) |
| Long Term Average | 5.83% |
| Average Growth Rate | 6.75% |
| Value from Last Quarter | 2.50% |
| Change from Last Quarter | -80.00% |
| Value from 1 Year Ago | 1.00% |
| Change from 1 Year Ago | -50.00% |
| Frequency | Quarterly |
| Unit | Percent |
| Adjustment | N/A |
| Download Source File |
Historical Data
| Date | Value |
|---|---|
| March 27, 2026 | 0.50% |
| December 31, 2025 | 2.50% |
| September 26, 2025 | 3.00% |
| June 27, 2025 | 1.50% |
| March 28, 2025 | 0.00% |
| December 31, 2024 | 1.00% |
| September 27, 2024 | 0.50% |
| June 28, 2024 | -3.50% |
| March 29, 2024 | -4.00% |
| December 31, 2023 | -11.50% |
| September 29, 2023 | -11.50% |
| June 30, 2023 | -7.00% |
| March 31, 2023 | -4.00% |
| Date | Value |
|---|---|
| December 31, 2022 | 7.50% |
| September 30, 2022 | 10.00% |
| July 01, 2022 | 9.50% |
| April 01, 2022 | 12.00% |
| December 31, 2021 | 19.50% |
| October 01, 2021 | 20.50% |
| July 02, 2021 | 31.50% |
| April 02, 2021 | 30.00% |
| December 31, 2020 | 15.50% |
| October 02, 2020 | 14.00% |
| July 03, 2020 | 3.50% |
| April 03, 2020 | 4.50% |
| December 31, 2019 | 6.00% |
News
Basic Info
|
Danaher Corp (DHR) - Core Sales Growth is at 0.50%, compared to 2.50% last quarter and 1.00% last year. This is lower than the long term average of 5.83%. |
|
Danaher Corp Core Sales Growth represents the year-over-year increase in sales or revenues from its existing business segments, excluding the impact of acquisitions, divestitures, or significant currency fluctuations. |
| Report | Fiscal.ai |
| Category | Segments & KPIs |
| Region | United States |
| Source | Fiscal.ai |
|
Data provided via Fiscal.ai |
Stats
| Last Value | 0.50% |
| Latest Period | Mar 2026 |
| Last Updated | May 20 2026, 18:18 EDT |
| Next Release | Jul 15 2026, 08:30 EDT (E) |
| Long Term Average | 5.83% |
| Average Growth Rate | 6.75% |
| Value from Last Quarter | 2.50% |
| Change from Last Quarter | -80.00% |
| Value from 1 Year Ago | 1.00% |
| Change from 1 Year Ago | -50.00% |
| Frequency | Quarterly |
| Unit | Percent |
| Adjustment | N/A |
| Download Source File |
Related Securities
Related Indicators
| Danaher Corp (DHR) - Biotechnology Operating Income | 534.00M USD |
| Danaher Corp (DHR) - Biotechnology Revenue | 1.797B USD |
| Danaher Corp (DHR) - Diagnostics Operating Income | 713.00M USD |
| Danaher Corp (DHR) - Diagnostics Revenue | 2.72B USD |
| Danaher Corp (DHR) - Former Life Sciences Operating Income | 876.00M USD |
| Danaher Corp (DHR) - Former Life Sciences Revenue | 4.118B USD |
| Danaher Corp (DHR) - Life Sciences Operating Income | 225.00M USD |
| Danaher Corp (DHR) - Life Sciences Revenue | 1.737B USD |
| Danaher Corp (DHR) - Non-Recurring Revenue | 920.00M USD |
| Danaher Corp (DHR) - Recurring Revenue | 5.031B USD |