

Oil VIX (I:OVIX)
58.30 for May 28 2026
Level Chart
Basic Info
|
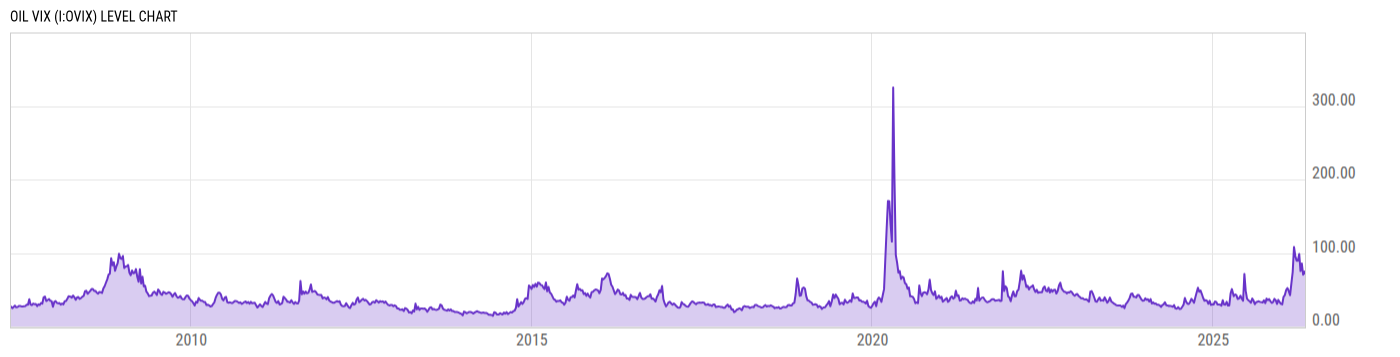
Oil VIX is at a current level of 58.30, down from 59.97 the previous market day and up from 40.42 one year ago. This is a change of -2.78% from the previous market day and 44.24% from one year ago. |
| Report | CBOE Volatility Indexes |
| Category | Market Indices and Statistics |
| Region | United States |
| Source | Chicago Board Options Exchange |
Stats
| Last Value | 58.30 |
| Latest Period | May 28 2026 |
| Last Updated | May 28 2026, 23:01 EDT |
| Next Release | May 29 2026, 23:00 EDT |
| Average Growth Rate | 47.33% |
| Value from The Previous Market Day | 59.97 |
| Change from The Previous Market Day | -2.78% |
| Value from 1 Year Ago | 40.42 |
| Change from 1 Year Ago | 44.24% |
| Frequency | Market Daily |
| Adjustment | N/A |
| Download Source File |
Historical Data
| Date | Value |
|---|---|
| May 28, 2026 | 58.30 |
| May 27, 2026 | 59.97 |
| May 26, 2026 | 65.06 |
| May 22, 2026 | 75.97 |
| May 21, 2026 | 73.54 |
| May 20, 2026 | 72.77 |
| May 19, 2026 | 72.89 |
| May 18, 2026 | 72.07 |
| May 15, 2026 | 72.35 |
| May 14, 2026 | 68.92 |
| May 13, 2026 | 70.94 |
| May 12, 2026 | 75.69 |
| May 11, 2026 | 75.66 |
| May 08, 2026 | 72.15 |
| May 07, 2026 | 72.25 |
| May 06, 2026 | 72.34 |
| May 05, 2026 | 74.73 |
| May 04, 2026 | 78.63 |
| May 01, 2026 | 75.40 |
| April 30, 2026 | 75.08 |
| April 29, 2026 | 75.96 |
| April 28, 2026 | 70.50 |
| April 27, 2026 | 73.11 |
| April 24, 2026 | 75.83 |
| April 23, 2026 | 78.67 |
| Date | Value |
|---|---|
| April 22, 2026 | 76.77 |
| April 21, 2026 | 85.57 |
| April 20, 2026 | 73.79 |
| April 17, 2026 | 69.01 |
| April 16, 2026 | 73.04 |
| April 15, 2026 | 72.23 |
| April 14, 2026 | 75.35 |
| April 13, 2026 | 80.55 |
| April 10, 2026 | 78.01 |
| April 09, 2026 | 81.74 |
| April 08, 2026 | 83.91 |
| April 07, 2026 | 98.79 |
| April 06, 2026 | 96.14 |
| April 02, 2026 | 93.14 |
| April 01, 2026 | 91.80 |
| March 31, 2026 | 89.39 |
| March 30, 2026 | 95.84 |
| March 27, 2026 | 96.64 |
| March 26, 2026 | 92.37 |
| March 25, 2026 | 90.16 |
| March 24, 2026 | 89.34 |
| March 23, 2026 | 89.78 |
| March 20, 2026 | 91.85 |
| March 19, 2026 | 92.68 |
| March 18, 2026 | 97.28 |
News
Headline
Time (ET)
Basic Info
|
Oil VIX is at a current level of 58.30, down from 59.97 the previous market day and up from 40.42 one year ago. This is a change of -2.78% from the previous market day and 44.24% from one year ago. |
| Report | CBOE Volatility Indexes |
| Category | Market Indices and Statistics |
| Region | United States |
| Source | Chicago Board Options Exchange |
Stats
| Last Value | 58.30 |
| Latest Period | May 28 2026 |
| Last Updated | May 28 2026, 23:01 EDT |
| Next Release | May 29 2026, 23:00 EDT |
| Average Growth Rate | 47.33% |
| Value from The Previous Market Day | 59.97 |
| Change from The Previous Market Day | -2.78% |
| Value from 1 Year Ago | 40.42 |
| Change from 1 Year Ago | 44.24% |
| Frequency | Market Daily |
| Adjustment | N/A |
| Download Source File |