

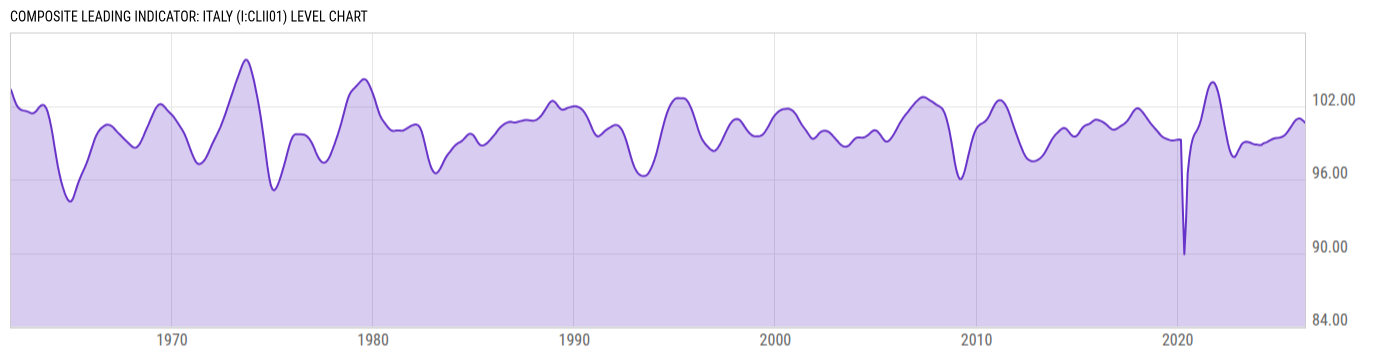
Composite Leading Indicator: Italy (I:CLII01)
100.64 for Apr 2026
Level Chart
Basic Info
|
Composite Leading Indicator: Italy is at a current level of 100.64, down from 100.78 last month and up from 99.64 one year ago. This is a change of -0.14% from last month and 1.01% from one year ago. |
| Region | Italy |
| Source | Organisation for Economic Co-operation and Development |
|
OECD (2026), Composite leading indicator (CLI) (indicator). doi: 10.1787/4a174487-en (Accessed on 23 May 2026) |
Stats
| Last Value | 100.64 |
| Latest Period | Apr 2026 |
| Last Updated | May 7 2026, 08:38 EDT |
| Next Release | May 28 2026, 06:00 EDT |
| Average Growth Rate | -0.03% |
| Value from Last Month | 100.78 |
| Change from Last Month | -0.14% |
| Value from 1 Year Ago | 99.64 |
| Change from 1 Year Ago | 1.01% |
| Frequency | Monthly |
| Adjustment | N/A |
| Download Source File |
Historical Data
| Date | Value |
|---|---|
| April 30, 2026 | 100.64 |
| March 31, 2026 | 100.78 |
| February 28, 2026 | 100.90 |
| January 31, 2026 | 100.97 |
| December 31, 2025 | 100.98 |
| November 30, 2025 | 100.91 |
| October 31, 2025 | 100.78 |
| September 30, 2025 | 100.60 |
| August 31, 2025 | 100.39 |
| July 31, 2025 | 100.17 |
| June 30, 2025 | 99.97 |
| May 31, 2025 | 99.79 |
| April 30, 2025 | 99.64 |
| March 31, 2025 | 99.53 |
| February 28, 2025 | 99.47 |
| January 31, 2025 | 99.43 |
| December 31, 2024 | 99.40 |
| November 30, 2024 | 99.39 |
| October 31, 2024 | 99.37 |
| September 30, 2024 | 99.33 |
| August 31, 2024 | 99.26 |
| July 31, 2024 | 99.19 |
| June 30, 2024 | 99.11 |
| May 31, 2024 | 99.04 |
| April 30, 2024 | 98.99 |
| Date | Value |
|---|---|
| March 31, 2024 | 98.94 |
| February 29, 2024 | 98.81 |
| January 31, 2024 | 98.82 |
| December 31, 2023 | 98.83 |
| November 30, 2023 | 98.86 |
| October 31, 2023 | 98.86 |
| September 30, 2023 | 98.91 |
| August 31, 2023 | 98.96 |
| July 31, 2023 | 99.02 |
| June 30, 2023 | 99.06 |
| May 31, 2023 | 99.08 |
| April 30, 2023 | 99.06 |
| March 31, 2023 | 98.99 |
| February 28, 2023 | 98.82 |
| January 31, 2023 | 98.58 |
| December 31, 2022 | 98.31 |
| November 30, 2022 | 98.01 |
| October 31, 2022 | 97.83 |
| September 30, 2022 | 97.86 |
| August 31, 2022 | 98.05 |
| July 31, 2022 | 98.42 |
| June 30, 2022 | 98.98 |
| May 31, 2022 | 99.66 |
| April 30, 2022 | 100.38 |
| March 31, 2022 | 101.13 |
News
Headline
Time (ET)
05/13 07:39
05/11 07:48
05/05 07:10
04/30 09:10
Basic Info
|
Composite Leading Indicator: Italy is at a current level of 100.64, down from 100.78 last month and up from 99.64 one year ago. This is a change of -0.14% from last month and 1.01% from one year ago. |
| Region | Italy |
| Source | Organisation for Economic Co-operation and Development |
|
OECD (2026), Composite leading indicator (CLI) (indicator). doi: 10.1787/4a174487-en (Accessed on 23 May 2026) |
Stats
| Last Value | 100.64 |
| Latest Period | Apr 2026 |
| Last Updated | May 7 2026, 08:38 EDT |
| Next Release | May 28 2026, 06:00 EDT |
| Average Growth Rate | -0.03% |
| Value from Last Month | 100.78 |
| Change from Last Month | -0.14% |
| Value from 1 Year Ago | 99.64 |
| Change from 1 Year Ago | 1.01% |
| Frequency | Monthly |
| Adjustment | N/A |
| Download Source File |