

Comcast Corp Class A (CMCSA) - Corporate & Other Revenue (I:CCCAZ7C5)
Level Chart
Basic Info
|
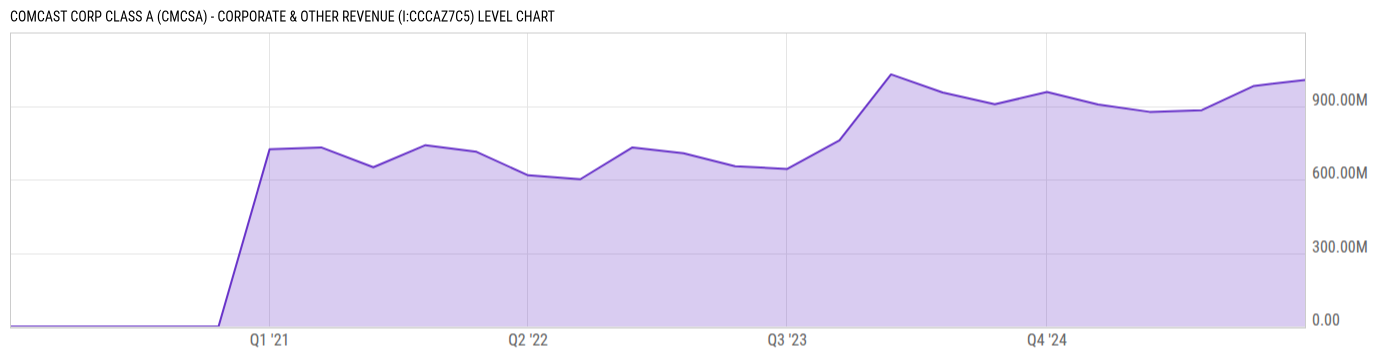
Comcast Corp Class A (CMCSA) - Corporate & Other Revenue is at a current level of 1.006B, up from 982.00M last quarter and up from 906.00M one year ago. This is a change of 2.44% from last quarter and 11.04% from one year ago. |
|
Comcast Corp Class A Corporate & Other Revenue refers to the revenue generated by the corporation that falls outside of its primary operating segments, such as Media, Studios, Theme Parks, Connectivity & Platforms, and Content & Experiences |
| Report | Fiscal.ai |
| Category | Segments & KPIs |
| Region | United States |
| Source | Fiscal.ai |
|
Data provided via Fiscal.ai |
Stats
| Last Value | 1.006B |
| Latest Period | Mar 2026 |
| Last Updated | May 20 2026, 18:18 EDT |
| Next Release | Jul 15 2026, 08:30 EDT (E) |
| Average Growth Rate | 9.21% |
| Value from Last Quarter | 982.00M |
| Change from Last Quarter | 2.44% |
| Value from 1 Year Ago | 906.00M |
| Change from 1 Year Ago | 11.04% |
| Frequency | Quarterly |
| Unit | USD |
| Adjustment | N/A |
| Download Source File |
Historical Data
| Date | Value |
|---|---|
| March 31, 2026 | 1.006B |
| December 31, 2025 | 982.00M |
| September 30, 2025 | 883.00M |
| June 30, 2025 | 876.00M |
| March 31, 2025 | 906.00M |
| December 31, 2024 | 957.00M |
| September 30, 2024 | 907.00M |
| June 30, 2024 | 955.00M |
| March 31, 2024 | 1.029B |
| December 31, 2023 | 760.00M |
| September 30, 2023 | 643.00M |
| June 30, 2023 | 654.00M |
| March 31, 2023 | 707.00M |
| Date | Value |
|---|---|
| December 31, 2022 | 731.00M |
| September 30, 2022 | 601.00M |
| June 30, 2022 | 617.00M |
| March 31, 2022 | 713.00M |
| December 31, 2021 | 740.00M |
| September 30, 2021 | 650.00M |
| June 30, 2021 | 731.00M |
| March 31, 2021 | 723.00M |
| December 31, 2020 | 0.00 |
| September 30, 2020 | 0.00 |
| June 30, 2020 | 0.00 |
| March 31, 2020 | 0.00 |
| December 31, 2019 | 0.00 |
News
Basic Info
|
Comcast Corp Class A (CMCSA) - Corporate & Other Revenue is at a current level of 1.006B, up from 982.00M last quarter and up from 906.00M one year ago. This is a change of 2.44% from last quarter and 11.04% from one year ago. |
|
Comcast Corp Class A Corporate & Other Revenue refers to the revenue generated by the corporation that falls outside of its primary operating segments, such as Media, Studios, Theme Parks, Connectivity & Platforms, and Content & Experiences |
| Report | Fiscal.ai |
| Category | Segments & KPIs |
| Region | United States |
| Source | Fiscal.ai |
|
Data provided via Fiscal.ai |
Stats
| Last Value | 1.006B |
| Latest Period | Mar 2026 |
| Last Updated | May 20 2026, 18:18 EDT |
| Next Release | Jul 15 2026, 08:30 EDT (E) |
| Average Growth Rate | 9.21% |
| Value from Last Quarter | 982.00M |
| Change from Last Quarter | 2.44% |
| Value from 1 Year Ago | 906.00M |
| Change from 1 Year Ago | 11.04% |
| Frequency | Quarterly |
| Unit | USD |
| Adjustment | N/A |
| Download Source File |