

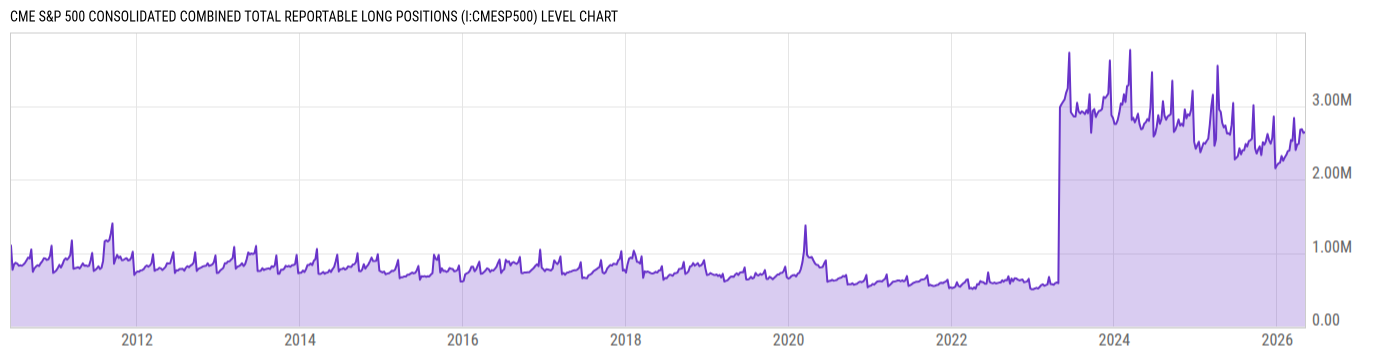
CME S&P 500 Consolidated Combined Total Reportable Long Positions (I:CMESP500)
2.794M for Wk of May 26 2026
Level Chart
Basic Info
|
CME S&P 500 Consolidated Combined Total Reportable Long Positions is at a current level of 2.794M, up from 2.726M last week and up from 2.627M one year ago. This is a change of 2.48% from last week and 6.34% from one year ago. |
| Report | Commitments of Traders |
| Category | Market Indices and Statistics |
| Region | N/A |
| Source | US Commodity Futures Trading Commission |
Stats
| Last Value | 2.794M |
| Latest Period | May 26 2026 |
| Last Updated | May 29 2026, 15:36 EDT |
| Next Release | Jun 5 2026, 15:30 EDT |
| Average Growth Rate | 41.73% |
| Value from Last Week | 2.726M |
| Change from Last Week | 2.48% |
| Value from 1 Year Ago | 2.627M |
| Change from 1 Year Ago | 6.34% |
| Frequency | Weekly |
| Adjustment | N/A |
| Download Source File |
Historical Data
| Date | Value |
|---|---|
| May 26, 2026 | 2.794M |
| May 19, 2026 | 2.726M |
| May 12, 2026 | 2.799M |
| May 05, 2026 | 2.644M |
| April 28, 2026 | 2.634M |
| April 21, 2026 | 2.684M |
| April 14, 2026 | 2.677M |
| April 07, 2026 | 2.487M |
| March 31, 2026 | 2.477M |
| March 24, 2026 | 2.403M |
| March 17, 2026 | 2.838M |
| March 10, 2026 | 2.525M |
| March 03, 2026 | 2.537M |
| February 24, 2026 | 2.394M |
| February 17, 2026 | 2.386M |
| February 10, 2026 | 2.332M |
| February 03, 2026 | 2.299M |
| January 27, 2026 | 2.255M |
| January 20, 2026 | 2.320M |
| January 13, 2026 | 2.229M |
| January 06, 2026 | 2.218M |
| December 30, 2025 | 2.192M |
| December 23, 2025 | 2.152M |
| December 16, 2025 | 2.857M |
| December 09, 2025 | 2.561M |
| Date | Value |
|---|---|
| December 02, 2025 | 2.487M |
| November 25, 2025 | 2.533M |
| November 18, 2025 | 2.620M |
| November 10, 2025 | 2.513M |
| November 04, 2025 | 2.475M |
| October 28, 2025 | 2.508M |
| October 21, 2025 | 2.333M |
| October 14, 2025 | 2.451M |
| October 07, 2025 | 2.407M |
| September 30, 2025 | 2.353M |
| September 23, 2025 | 2.427M |
| September 16, 2025 | 3.011M |
| September 09, 2025 | 2.555M |
| September 02, 2025 | 2.533M |
| August 26, 2025 | 2.521M |
| August 19, 2025 | 2.451M |
| August 12, 2025 | 2.484M |
| August 05, 2025 | 2.397M |
| July 29, 2025 | 2.399M |
| July 22, 2025 | 2.342M |
| July 15, 2025 | 2.424M |
| July 08, 2025 | 2.319M |
| July 01, 2025 | 2.296M |
| June 24, 2025 | 2.273M |
| June 17, 2025 | 3.041M |
News
Headline
Time (ET)
05/29 07:59
05/26 08:53
05/22 07:53
05/20 06:48
Basic Info
|
CME S&P 500 Consolidated Combined Total Reportable Long Positions is at a current level of 2.794M, up from 2.726M last week and up from 2.627M one year ago. This is a change of 2.48% from last week and 6.34% from one year ago. |
| Report | Commitments of Traders |
| Category | Market Indices and Statistics |
| Region | N/A |
| Source | US Commodity Futures Trading Commission |
Stats
| Last Value | 2.794M |
| Latest Period | May 26 2026 |
| Last Updated | May 29 2026, 15:36 EDT |
| Next Release | Jun 5 2026, 15:30 EDT |
| Average Growth Rate | 41.73% |
| Value from Last Week | 2.726M |
| Change from Last Week | 2.48% |
| Value from 1 Year Ago | 2.627M |
| Change from 1 Year Ago | 6.34% |
| Frequency | Weekly |
| Adjustment | N/A |
| Download Source File |