

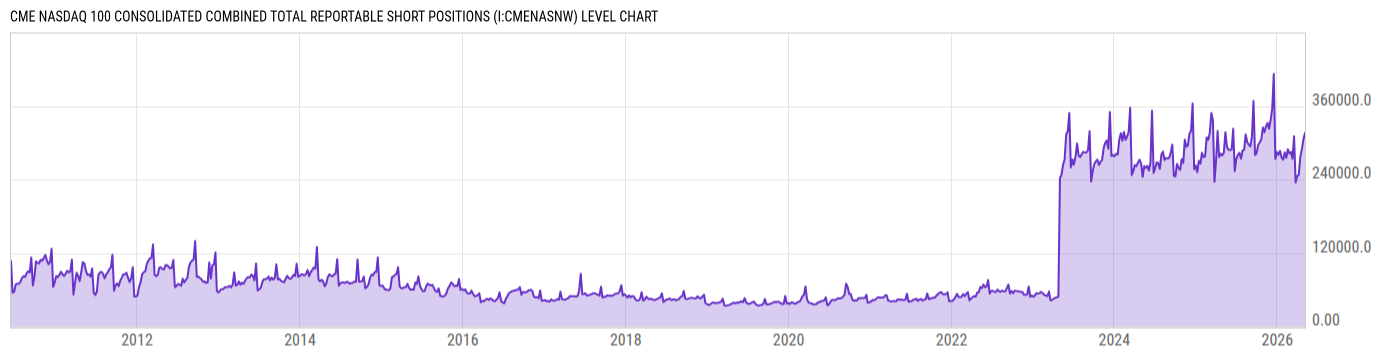
CME NASDAQ 100 Consolidated Combined Total Reportable Short Positions (I:CMENASNW)
336672.0 for Wk of May 26 2026
Level Chart
Basic Info
|
CME NASDAQ 100 Consolidated Combined Total Reportable Short Positions is at a current level of 336672.0, up from 323622.0 last week and up from 293427.0 one year ago. This is a change of 4.03% from last week and 14.74% from one year ago. |
| Report | Commitments of Traders |
| Category | Market Indices and Statistics |
| Region | N/A |
| Source | US Commodity Futures Trading Commission |
Stats
| Last Value | 336672.0 |
| Latest Period | May 26 2026 |
| Last Updated | May 29 2026, 15:36 EDT |
| Next Release | Jun 5 2026, 15:30 EDT |
| Average Growth Rate | 65.28% |
| Value from Last Week | 323622.0 |
| Change from Last Week | 4.03% |
| Value from 1 Year Ago | 293427.0 |
| Change from 1 Year Ago | 14.74% |
| Frequency | Weekly |
| Adjustment | N/A |
| Download Source File |
Historical Data
| Date | Value |
|---|---|
| May 26, 2026 | 336672.0 |
| May 19, 2026 | 323622.0 |
| May 12, 2026 | 325609.0 |
| May 05, 2026 | 316069.0 |
| April 28, 2026 | 305576.0 |
| April 21, 2026 | 289586.0 |
| April 14, 2026 | 276891.0 |
| April 07, 2026 | 247157.0 |
| March 31, 2026 | 245793.0 |
| March 24, 2026 | 235238.0 |
| March 17, 2026 | 310593.0 |
| March 10, 2026 | 274011.0 |
| March 03, 2026 | 284885.0 |
| February 24, 2026 | 282578.0 |
| February 17, 2026 | 289252.0 |
| February 10, 2026 | 275397.0 |
| February 03, 2026 | 283998.0 |
| January 27, 2026 | 272260.0 |
| January 20, 2026 | 275718.0 |
| January 13, 2026 | 286788.0 |
| January 06, 2026 | 280006.0 |
| December 30, 2025 | 285031.0 |
| December 23, 2025 | 273465.0 |
| December 16, 2025 | 412438.0 |
| December 09, 2025 | 355473.0 |
| Date | Value |
|---|---|
| December 02, 2025 | 337507.0 |
| November 25, 2025 | 322888.0 |
| November 18, 2025 | 332272.0 |
| November 10, 2025 | 325611.0 |
| November 04, 2025 | 317224.0 |
| October 28, 2025 | 324741.0 |
| October 21, 2025 | 305435.0 |
| October 14, 2025 | 300382.0 |
| October 07, 2025 | 296396.0 |
| September 30, 2025 | 282965.0 |
| September 23, 2025 | 279855.0 |
| September 16, 2025 | 368099.0 |
| September 09, 2025 | 309536.0 |
| September 02, 2025 | 294169.0 |
| August 26, 2025 | 296939.0 |
| August 19, 2025 | 300863.0 |
| August 12, 2025 | 313645.0 |
| August 05, 2025 | 288300.0 |
| July 29, 2025 | 287407.0 |
| July 22, 2025 | 273831.0 |
| July 15, 2025 | 283558.0 |
| July 08, 2025 | 280333.0 |
| July 01, 2025 | 273818.0 |
| June 24, 2025 | 253675.0 |
| June 17, 2025 | 322733.0 |
News
Headline
Time (ET)
05/29 07:59
05/26 08:53
05/22 07:53
05/20 06:48
Basic Info
|
CME NASDAQ 100 Consolidated Combined Total Reportable Short Positions is at a current level of 336672.0, up from 323622.0 last week and up from 293427.0 one year ago. This is a change of 4.03% from last week and 14.74% from one year ago. |
| Report | Commitments of Traders |
| Category | Market Indices and Statistics |
| Region | N/A |
| Source | US Commodity Futures Trading Commission |
Stats
| Last Value | 336672.0 |
| Latest Period | May 26 2026 |
| Last Updated | May 29 2026, 15:36 EDT |
| Next Release | Jun 5 2026, 15:30 EDT |
| Average Growth Rate | 65.28% |
| Value from Last Week | 323622.0 |
| Change from Last Week | 4.03% |
| Value from 1 Year Ago | 293427.0 |
| Change from 1 Year Ago | 14.74% |
| Frequency | Weekly |
| Adjustment | N/A |
| Download Source File |