

CME NASDAQ 100 Consolidated Combined Total Reportable Long Positions (I:CMENASDA)
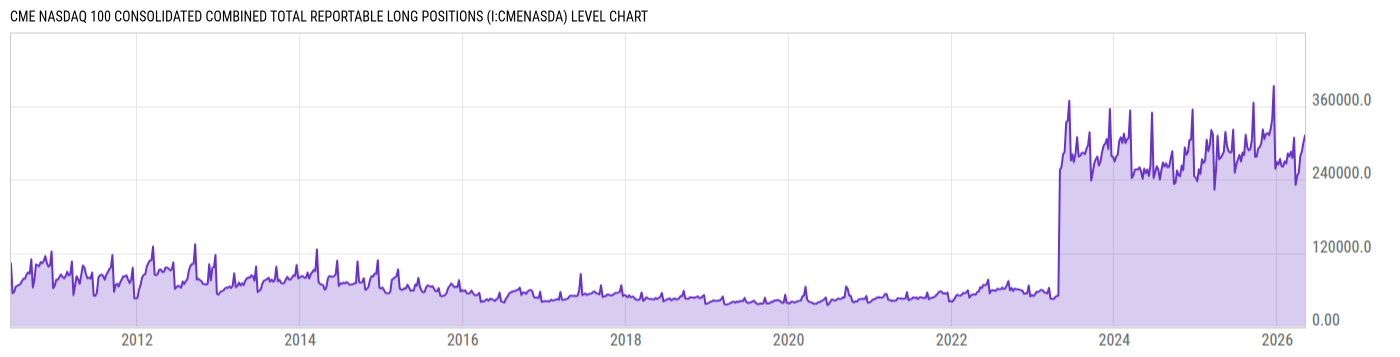
326231.0 for Wk of May 26 2026
Level Chart
Basic Info
|
CME NASDAQ 100 Consolidated Combined Total Reportable Long Positions is at a current level of 326231.0, up from 314245.0 last week and up from 295264.0 one year ago. This is a change of 3.81% from last week and 10.49% from one year ago. |
| Report | Commitments of Traders |
| Category | Market Indices and Statistics |
| Region | N/A |
| Source | US Commodity Futures Trading Commission |
Stats
| Last Value | 326231.0 |
| Latest Period | May 26 2026 |
| Last Updated | May 29 2026, 15:36 EDT |
| Next Release | Jun 5 2026, 15:30 EDT |
| Average Growth Rate | 66.19% |
| Value from Last Week | 314245.0 |
| Change from Last Week | 3.81% |
| Value from 1 Year Ago | 295264.0 |
| Change from 1 Year Ago | 10.49% |
| Frequency | Weekly |
| Adjustment | N/A |
| Download Source File |
Historical Data
| Date | Value |
|---|---|
| May 26, 2026 | 326231.0 |
| May 19, 2026 | 314245.0 |
| May 12, 2026 | 319183.0 |
| May 05, 2026 | 311703.0 |
| April 28, 2026 | 300387.0 |
| April 21, 2026 | 285840.0 |
| April 14, 2026 | 278256.0 |
| April 07, 2026 | 251308.0 |
| March 31, 2026 | 246107.0 |
| March 24, 2026 | 231144.0 |
| March 17, 2026 | 308191.0 |
| March 10, 2026 | 275042.0 |
| March 03, 2026 | 285459.0 |
| February 24, 2026 | 277581.0 |
| February 17, 2026 | 282527.0 |
| February 10, 2026 | 266165.0 |
| February 03, 2026 | 269629.0 |
| January 27, 2026 | 261185.0 |
| January 20, 2026 | 261720.0 |
| January 13, 2026 | 273506.0 |
| January 06, 2026 | 264481.0 |
| December 30, 2025 | 268531.0 |
| December 23, 2025 | 257510.0 |
| December 16, 2025 | 392773.0 |
| December 09, 2025 | 338720.0 |
| Date | Value |
|---|---|
| December 02, 2025 | 322336.0 |
| November 25, 2025 | 312321.0 |
| November 18, 2025 | 315833.0 |
| November 10, 2025 | 313893.0 |
| November 04, 2025 | 306034.0 |
| October 28, 2025 | 321560.0 |
| October 21, 2025 | 299388.0 |
| October 14, 2025 | 292640.0 |
| October 07, 2025 | 290875.0 |
| September 30, 2025 | 276967.0 |
| September 23, 2025 | 277168.0 |
| September 16, 2025 | 365225.0 |
| September 09, 2025 | 305460.0 |
| September 02, 2025 | 289353.0 |
| August 26, 2025 | 287765.0 |
| August 19, 2025 | 292666.0 |
| August 12, 2025 | 313010.0 |
| August 05, 2025 | 279788.0 |
| July 29, 2025 | 284085.0 |
| July 22, 2025 | 269390.0 |
| July 15, 2025 | 280265.0 |
| July 08, 2025 | 272586.0 |
| July 01, 2025 | 264219.0 |
| June 24, 2025 | 250877.0 |
| June 17, 2025 | 321405.0 |
News
Headline
Time (ET)
05/29 07:59
05/26 08:53
05/22 07:53
05/20 06:48
Basic Info
|
CME NASDAQ 100 Consolidated Combined Total Reportable Long Positions is at a current level of 326231.0, up from 314245.0 last week and up from 295264.0 one year ago. This is a change of 3.81% from last week and 10.49% from one year ago. |
| Report | Commitments of Traders |
| Category | Market Indices and Statistics |
| Region | N/A |
| Source | US Commodity Futures Trading Commission |
Stats
| Last Value | 326231.0 |
| Latest Period | May 26 2026 |
| Last Updated | May 29 2026, 15:36 EDT |
| Next Release | Jun 5 2026, 15:30 EDT |
| Average Growth Rate | 66.19% |
| Value from Last Week | 314245.0 |
| Change from Last Week | 3.81% |
| Value from 1 Year Ago | 295264.0 |
| Change from 1 Year Ago | 10.49% |
| Frequency | Weekly |
| Adjustment | N/A |
| Download Source File |