

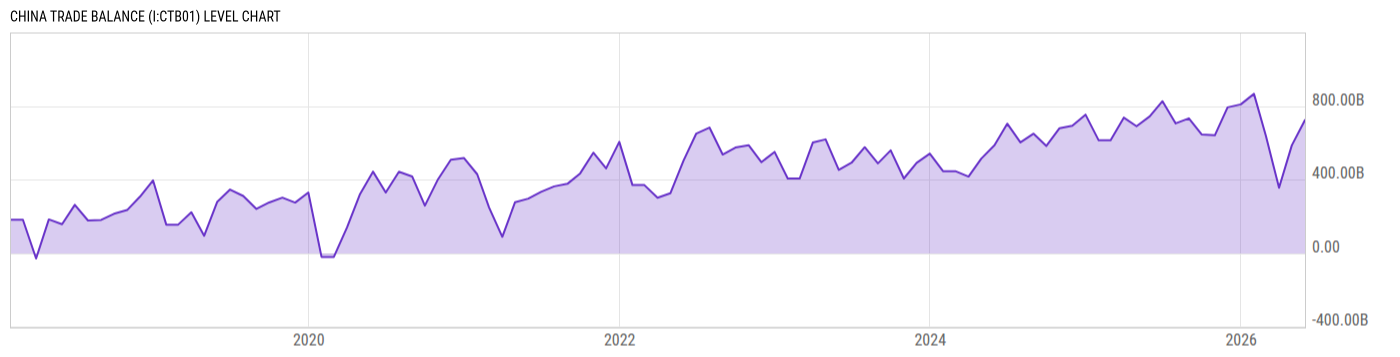
China Trade Balance (I:CTB01)
723.98B CNY for May 2026
Level Chart
Basic Info
|
China Trade Balance is at a current level of 723.98B, up from 585.69B last month and down from 743.56B one year ago. This is a change of 23.61% from last month and -2.63% from one year ago. |
| Report | China Customs Statistics |
| Category | International Transactions |
| Region | China |
| Source | General Administration of Customs |
Stats
| Last Value | 723.98B |
| Latest Period | May 2026 |
| Last Updated | Jun 15 2026, 09:53 EDT |
| Next Release | Jul 14 2026, 11:00 EDT |
| Average Growth Rate | -108.1% |
| Value from Last Month | 585.69B |
| Change from Last Month | 23.61% |
| Value from 1 Year Ago | 743.56B |
| Change from 1 Year Ago | -2.63% |
| Frequency | Monthly |
| Unit | CNY |
| Adjustment | N/A |
| Download Source File |
Historical Data
| Date | Value |
|---|---|
| May 31, 2026 | 723.98B |
| April 30, 2026 | 585.69B |
| March 31, 2026 | 354.75B |
| February 28, 2026 | 637.55B |
| January 31, 2026 | 865.94B |
| December 31, 2025 | 808.77B |
| November 30, 2025 | 792.58B |
| October 31, 2025 | 640.49B |
| September 30, 2025 | 645.47B |
| August 31, 2025 | 732.68B |
| July 31, 2025 | 705.10B |
| June 30, 2025 | 825.97B |
| May 31, 2025 | 743.56B |
| April 30, 2025 | 689.99B |
| March 31, 2025 | 736.72B |
| February 28, 2025 | 613.03B |
| January 31, 2025 | 613.03B |
| December 31, 2024 | 752.91B |
| November 30, 2024 | 692.80B |
| October 31, 2024 | 679.10B |
| September 30, 2024 | 582.62B |
| August 31, 2024 | 649.34B |
| July 31, 2024 | 601.90B |
| June 30, 2024 | 703.73B |
| May 31, 2024 | 586.40B |
| Date | Value |
|---|---|
| April 30, 2024 | 513.45B |
| March 31, 2024 | 415.86B |
| February 29, 2024 | 445.43B |
| January 31, 2024 | 445.43B |
| December 31, 2023 | 540.90B |
| November 30, 2023 | 490.82B |
| October 31, 2023 | 405.47B |
| September 30, 2023 | 558.74B |
| August 31, 2023 | 488.00B |
| July 31, 2023 | 575.70B |
| June 30, 2023 | 491.25B |
| May 31, 2023 | 452.33B |
| April 30, 2023 | 618.44B |
| March 31, 2023 | 601.01B |
| February 28, 2023 | 405.16B |
| January 31, 2023 | 405.16B |
| December 31, 2022 | 550.11B |
| November 30, 2022 | 494.33B |
| October 31, 2022 | 586.81B |
| September 30, 2022 | 573.57B |
| August 31, 2022 | 535.91B |
| July 31, 2022 | 682.69B |
| June 30, 2022 | 650.11B |
| May 31, 2022 | 502.89B |
| April 30, 2022 | 325.08B |
News
Headline
Time (ET)
07/08 05:06
07/07 12:22
07/07 10:33
Canada's Merchandise Trade Surplus Tops Views in May; Excess With US Hits Highest Since January 2025
07/07 09:01
06/29 14:37
06/22 17:00
06/17 06:42
Basic Info
|
China Trade Balance is at a current level of 723.98B, up from 585.69B last month and down from 743.56B one year ago. This is a change of 23.61% from last month and -2.63% from one year ago. |
| Report | China Customs Statistics |
| Category | International Transactions |
| Region | China |
| Source | General Administration of Customs |
Stats
| Last Value | 723.98B |
| Latest Period | May 2026 |
| Last Updated | Jun 15 2026, 09:53 EDT |
| Next Release | Jul 14 2026, 11:00 EDT |
| Average Growth Rate | -108.1% |
| Value from Last Month | 585.69B |
| Change from Last Month | 23.61% |
| Value from 1 Year Ago | 743.56B |
| Change from 1 Year Ago | -2.63% |
| Frequency | Monthly |
| Unit | CNY |
| Adjustment | N/A |
| Download Source File |
Related Indicators
| China Economy |
| China Exports CNY YoY | 13.66% |
| China Exports YoY | 19.20% |
| China GDP | 33.42T CNY |
| China GDP | 140.19T CNY |
| China Imports CNY YoY | 21.57% |
| China Imports YoY | 27.47% |
| China Inflation Rate | 1.00% |
| China Loan Prime Rate | 3.00% |
| China M2 Money Supply YoY | 8.56% |
| China PMI | 50.30 |
| China Producer Price Index YoY | 4.10% |
| China Real GDP QoQ | 1.30% |
| China Real GDP YoY | 5.00% |
| China Trade Balance | 105.43B USD |
| China Urban Survey Unemployment Rate | 5.10% |
| China Urban Survey Unemployment Rate: 31 Cities | 5.10% |