

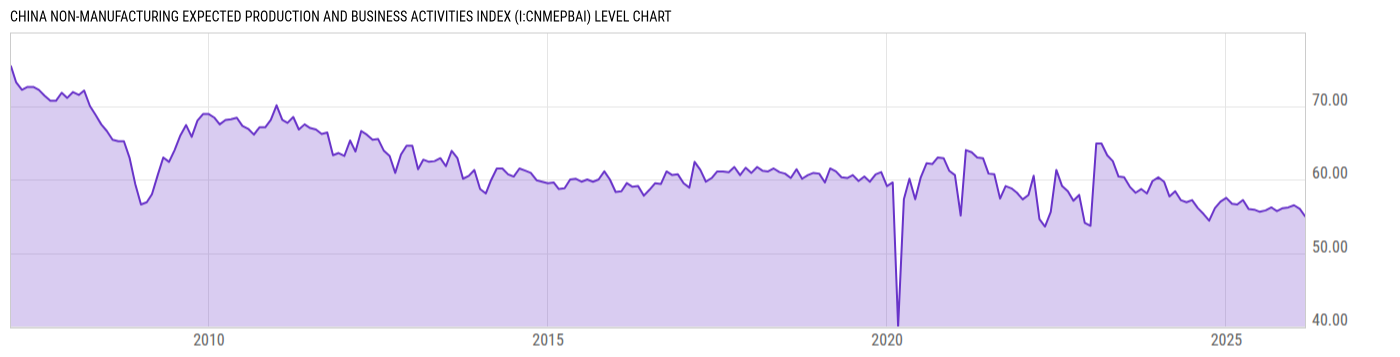
China Non-Manufacturing Expected Production and Business Activities Index (I:CNMEPBAI)
55.00 for Feb 2026
Level Chart
Basic Info
|
China Non-Manufacturing Expected Production and Business Activities Index is at a current level of 55.00, down from 56.00 last month and down from 56.60 one year ago. This is a change of -1.79% from last month and -2.83% from one year ago. |
Stats
| Last Value | 55.00 |
| Latest Period | Feb 2026 |
| Last Updated | Mar 4 2026, 08:23 EST |
| Next Release | May 30 2026, 21:00 EDT |
| Average Growth Rate | -0.42% |
| Value from Last Month | 56.00 |
| Change from Last Month | -1.79% |
| Value from 1 Year Ago | 56.60 |
| Change from 1 Year Ago | -2.83% |
| Frequency | Monthly |
| Adjustment | Seasonally Adjusted |
| Download Source File |
Historical Data
| Date | Value |
|---|---|
| February 28, 2026 | 55.00 |
| January 31, 2026 | 56.00 |
| December 31, 2025 | 56.50 |
| November 30, 2025 | 56.20 |
| October 31, 2025 | 56.10 |
| September 30, 2025 | 55.70 |
| August 31, 2025 | 56.20 |
| July 31, 2025 | 55.80 |
| June 30, 2025 | 55.60 |
| May 31, 2025 | 55.90 |
| April 30, 2025 | 56.00 |
| March 31, 2025 | 57.20 |
| February 28, 2025 | 56.60 |
| January 31, 2025 | 56.70 |
| December 31, 2024 | 57.50 |
| November 30, 2024 | 57.00 |
| October 31, 2024 | 56.10 |
| September 30, 2024 | 54.40 |
| August 31, 2024 | 55.30 |
| July 31, 2024 | 56.10 |
| June 30, 2024 | 57.20 |
| May 31, 2024 | 56.90 |
| April 30, 2024 | 57.20 |
| March 31, 2024 | 58.40 |
| February 29, 2024 | 57.70 |
| Date | Value |
|---|---|
| January 31, 2024 | 59.70 |
| December 31, 2023 | 60.30 |
| November 30, 2023 | 59.80 |
| October 31, 2023 | 58.10 |
| September 30, 2023 | 58.70 |
| August 31, 2023 | 58.20 |
| July 31, 2023 | 59.00 |
| June 30, 2023 | 60.30 |
| May 31, 2023 | 60.40 |
| April 30, 2023 | 62.50 |
| March 31, 2023 | 63.30 |
| February 28, 2023 | 64.90 |
| January 31, 2023 | 64.90 |
| December 31, 2022 | 53.70 |
| November 30, 2022 | 54.10 |
| October 31, 2022 | 57.90 |
| September 30, 2022 | 57.10 |
| August 31, 2022 | 58.40 |
| July 31, 2022 | 59.10 |
| June 30, 2022 | 61.30 |
| May 31, 2022 | 55.60 |
| April 30, 2022 | 53.60 |
| March 31, 2022 | 54.60 |
| February 28, 2022 | 60.50 |
| January 31, 2022 | 57.90 |
News
Headline
Time (ET)
05/22 07:41
05/08 13:15
05/01 12:49
Basic Info
|
China Non-Manufacturing Expected Production and Business Activities Index is at a current level of 55.00, down from 56.00 last month and down from 56.60 one year ago. This is a change of -1.79% from last month and -2.83% from one year ago. |
Stats
| Last Value | 55.00 |
| Latest Period | Feb 2026 |
| Last Updated | Mar 4 2026, 08:23 EST |
| Next Release | May 30 2026, 21:00 EDT |
| Average Growth Rate | -0.42% |
| Value from Last Month | 56.00 |
| Change from Last Month | -1.79% |
| Value from 1 Year Ago | 56.60 |
| Change from 1 Year Ago | -2.83% |
| Frequency | Monthly |
| Adjustment | Seasonally Adjusted |
| Download Source File |