

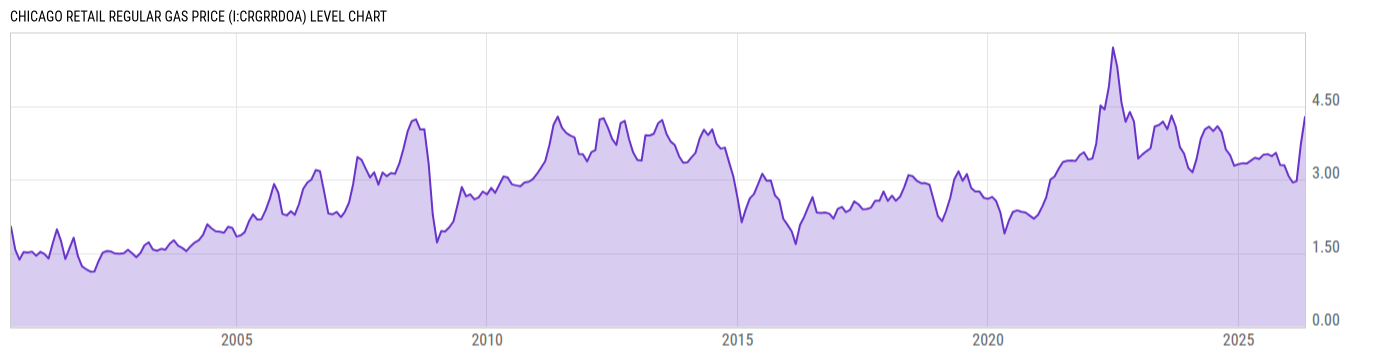
Chicago Retail Regular Gas Price (I:CRGRRDOA)
4.275 USD/gal for Apr 2026
Level Chart
Basic Info
|
Chicago Retail Regular Gas Price is at a current level of 4.275, up from 3.725 last month and up from 3.445 one year ago. This is a change of 14.77% from last month and 24.09% from one year ago. |
| Report | Weekly Retail Gasoline and On-Highway Diesel Prices |
| Category | Energy |
| Region | N/A |
| Source | Energy Information Administration |
Stats
| Last Value | 4.275 |
| Latest Period | Apr 2026 |
| Last Updated | Apr 28 2026, 17:08 EDT |
| Next Release | May 19 2026, 16:30 EDT |
| Average Growth Rate | 6.93% |
| Value from Last Month | 3.725 |
| Change from Last Month | 14.77% |
| Value from 1 Year Ago | 3.445 |
| Change from 1 Year Ago | 24.09% |
| Frequency | Monthly |
| Unit | USD per Gallon |
| Adjustment | N/A |
| Download Source File | |
| Notes | Includes both conventional and reformulated areas. |
Historical Data
| Date | Value |
|---|---|
| April 30, 2026 | 4.275 |
| March 31, 2026 | 3.725 |
| February 28, 2026 | 2.967 |
| January 31, 2026 | 2.937 |
| December 31, 2025 | 3.073 |
| November 30, 2025 | 3.291 |
| October 31, 2025 | 3.296 |
| September 30, 2025 | 3.545 |
| August 31, 2025 | 3.475 |
| July 31, 2025 | 3.518 |
| June 30, 2025 | 3.503 |
| May 31, 2025 | 3.419 |
| April 30, 2025 | 3.445 |
| March 31, 2025 | 3.384 |
| February 28, 2025 | 3.325 |
| January 31, 2025 | 3.334 |
| December 31, 2024 | 3.313 |
| November 30, 2024 | 3.28 |
| October 31, 2024 | 3.498 |
| September 30, 2024 | 3.612 |
| August 31, 2024 | 3.961 |
| July 31, 2024 | 4.088 |
| June 30, 2024 | 3.987 |
| May 31, 2024 | 4.078 |
| April 30, 2024 | 4.025 |
| Date | Value |
|---|---|
| March 31, 2024 | 3.829 |
| February 29, 2024 | 3.416 |
| January 31, 2024 | 3.147 |
| December 31, 2023 | 3.234 |
| November 30, 2023 | 3.531 |
| October 31, 2023 | 3.661 |
| September 30, 2023 | 4.082 |
| August 31, 2023 | 4.305 |
| July 31, 2023 | 4.024 |
| June 30, 2023 | 4.181 |
| May 31, 2023 | 4.111 |
| April 30, 2023 | 4.081 |
| March 31, 2023 | 3.637 |
| February 28, 2023 | 3.575 |
| January 31, 2023 | 3.513 |
| December 31, 2022 | 3.428 |
| November 30, 2022 | 4.181 |
| October 31, 2022 | 4.379 |
| September 30, 2022 | 4.177 |
| August 31, 2022 | 4.569 |
| July 31, 2022 | 5.298 |
| June 30, 2022 | 5.693 |
| May 31, 2022 | 4.893 |
| April 30, 2022 | 4.43 |
| March 31, 2022 | 4.51 |
News
Headline
Time (ET)
04/20 07:26
Basic Info
|
Chicago Retail Regular Gas Price is at a current level of 4.275, up from 3.725 last month and up from 3.445 one year ago. This is a change of 14.77% from last month and 24.09% from one year ago. |
| Report | Weekly Retail Gasoline and On-Highway Diesel Prices |
| Category | Energy |
| Region | N/A |
| Source | Energy Information Administration |
Stats
| Last Value | 4.275 |
| Latest Period | Apr 2026 |
| Last Updated | Apr 28 2026, 17:08 EDT |
| Next Release | May 19 2026, 16:30 EDT |
| Average Growth Rate | 6.93% |
| Value from Last Month | 3.725 |
| Change from Last Month | 14.77% |
| Value from 1 Year Ago | 3.445 |
| Change from 1 Year Ago | 24.09% |
| Frequency | Monthly |
| Unit | USD per Gallon |
| Adjustment | N/A |
| Download Source File | |
| Notes | Includes both conventional and reformulated areas. |