

Chicago Fed Survey of Economic Conditions Capital Spending Expectations Index (I:CFSBCCSE)
8.00 for Apr 2026
Level Chart
Basic Info
|
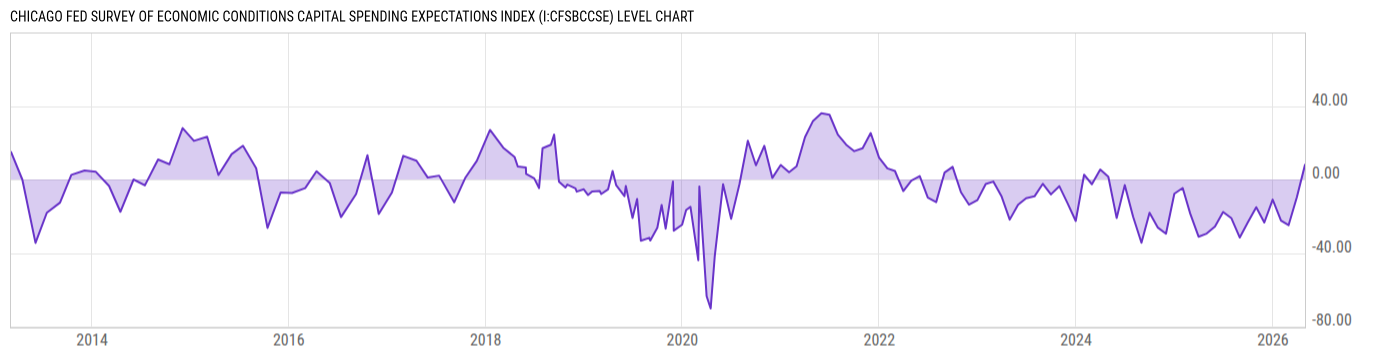
Chicago Fed Survey of Economic Conditions Capital Spending Expectations Index is at a current level of 8.000, up from -9.524 last month and up from -29.44 one year ago. This is a change of N/A from last month. |
| Region | N/A |
| Source | Federal Reserve Bank of Chicago |
Stats
| Last Value | 8.00 |
| Latest Period | Apr 2026 |
| Last Updated | Apr 22 2026, 10:02 EDT |
| Next Release | May 22 2026, 10:00 EDT |
| Average Growth Rate | 66.27% |
| Value from Last Month | -9.524 |
| Change from Last Month | N/A |
| Value from 1 Year Ago | -29.44 |
| Change from 1 Year Ago | N/A |
| Frequency | Monthly |
| Adjustment | N/A |
| Download Source File | |
| Notes | For the next 6 to 12 months |
Historical Data
| Date | Value |
|---|---|
| April 30, 2026 | 8.00 |
| March 31, 2026 | -9.524 |
| February 28, 2026 | -24.86 |
| January 31, 2026 | -22.34 |
| December 31, 2025 | -10.94 |
| November 30, 2025 | -23.41 |
| October 31, 2025 | -15.08 |
| September 30, 2025 | -23.32 |
| August 31, 2025 | -31.58 |
| July 31, 2025 | -21.11 |
| June 30, 2025 | -17.65 |
| May 31, 2025 | -25.59 |
| April 30, 2025 | -29.44 |
| March 31, 2025 | -31.13 |
| February 28, 2025 | -18.57 |
| January 31, 2025 | -4.639 |
| December 31, 2024 | -7.772 |
| November 30, 2024 | -29.53 |
| October 31, 2024 | -26.21 |
| September 30, 2024 | -18.06 |
| August 31, 2024 | -34.45 |
| July 31, 2024 | -20.29 |
| June 30, 2024 | -3.061 |
| May 31, 2024 | -21.00 |
| April 30, 2024 | 1.485 |
| Date | Value |
|---|---|
| March 31, 2024 | 5.405 |
| February 29, 2024 | -2.586 |
| January 31, 2024 | 2.609 |
| December 31, 2023 | -22.57 |
| November 30, 2023 | -12.71 |
| October 31, 2023 | -3.629 |
| September 30, 2023 | -8.108 |
| August 31, 2023 | -2.335 |
| July 31, 2023 | -9.160 |
| June 30, 2023 | -10.15 |
| May 31, 2023 | -13.74 |
| April 30, 2023 | -21.84 |
| March 31, 2023 | -9.302 |
| February 28, 2023 | -1.145 |
| January 31, 2023 | -2.429 |
| December 31, 2022 | -11.20 |
| November 30, 2022 | -13.72 |
| October 31, 2022 | -6.912 |
| September 30, 2022 | 6.870 |
| August 31, 2022 | 3.716 |
| July 31, 2022 | -12.31 |
| June 30, 2022 | -9.818 |
| May 31, 2022 | 1.816 |
| April 30, 2022 | -0.6456 |
| March 31, 2022 | -6.291 |
News
Headline
Time (ET)
05/13 06:37
05/08 13:15
05/04 06:14
Basic Info
|
Chicago Fed Survey of Economic Conditions Capital Spending Expectations Index is at a current level of 8.000, up from -9.524 last month and up from -29.44 one year ago. This is a change of N/A from last month. |
| Region | N/A |
| Source | Federal Reserve Bank of Chicago |
Stats
| Last Value | 8.00 |
| Latest Period | Apr 2026 |
| Last Updated | Apr 22 2026, 10:02 EDT |
| Next Release | May 22 2026, 10:00 EDT |
| Average Growth Rate | 66.27% |
| Value from Last Month | -9.524 |
| Change from Last Month | N/A |
| Value from 1 Year Ago | -29.44 |
| Change from 1 Year Ago | N/A |
| Frequency | Monthly |
| Adjustment | N/A |
| Download Source File | |
| Notes | For the next 6 to 12 months |