

Chicago Fed Survey of Economic Conditions Activity Index (I:CFSBCAI)
11.51 for May 2026
Level Chart
Basic Info
|
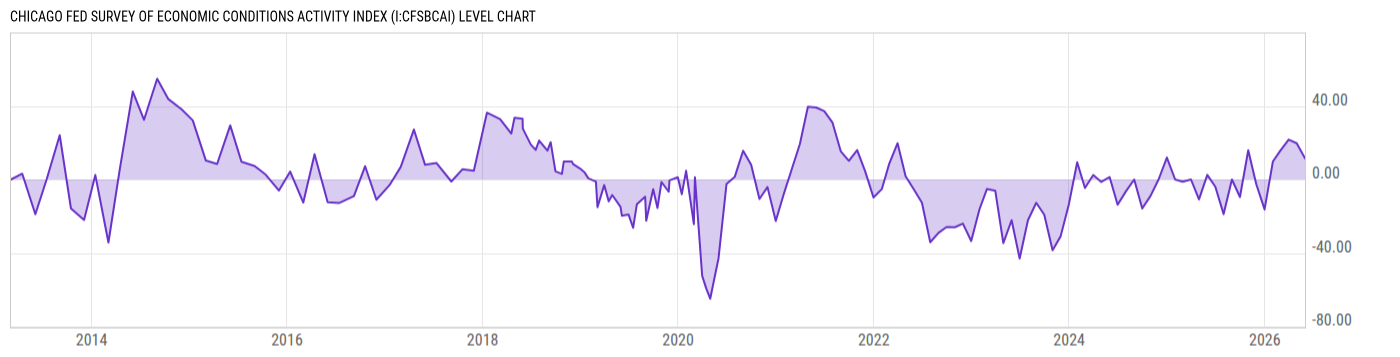
Chicago Fed Survey of Economic Conditions Activity Index is at a current level of 11.51, down from 19.72 last month and up from 2.510 one year ago. This is a change of -41.62% from last month and 358.5% from one year ago. |
| Region | N/A |
| Source | Federal Reserve Bank of Chicago |
Stats
| Last Value | 11.51 |
| Latest Period | May 2026 |
| Last Updated | May 22 2026, 10:05 EDT |
| Next Release | Jun 23 2026, 10:00 EDT |
| Average Growth Rate | -869.3% |
| Value from Last Month | 19.72 |
| Change from Last Month | -41.62% |
| Value from 1 Year Ago | 2.510 |
| Change from 1 Year Ago | 358.5% |
| Frequency | Monthly |
| Adjustment | N/A |
| Download Source File | |
| Notes | Following the April 15, 2020, release, the CFSBC will move to a monthly release schedule. The next CFSBC results will be released at 10:00 a.m. ET on May 12, 2020, with data for April 2020. |
Historical Data
| Date | Value |
|---|---|
| May 31, 2026 | 11.51 |
| April 30, 2026 | 19.72 |
| March 31, 2026 | 21.72 |
| February 28, 2026 | 15.71 |
| January 31, 2026 | 9.767 |
| December 31, 2025 | -16.29 |
| November 30, 2025 | -2.575 |
| October 31, 2025 | 15.93 |
| September 30, 2025 | -9.546 |
| August 31, 2025 | 0.00 |
| July 31, 2025 | -18.83 |
| June 30, 2025 | -3.930 |
| May 31, 2025 | 2.510 |
| April 30, 2025 | -10.84 |
| March 31, 2025 | 0.00 |
| February 28, 2025 | -1.224 |
| January 31, 2025 | 0.00 |
| December 31, 2024 | 11.95 |
| November 30, 2024 | 0.00 |
| October 31, 2024 | -8.898 |
| September 30, 2024 | -15.79 |
| August 31, 2024 | 0.00 |
| July 31, 2024 | -6.466 |
| June 30, 2024 | -13.70 |
| May 31, 2024 | 1.345 |
| Date | Value |
|---|---|
| April 30, 2024 | -1.316 |
| March 31, 2024 | 2.429 |
| February 29, 2024 | -4.615 |
| January 31, 2024 | 9.375 |
| December 31, 2023 | -13.41 |
| November 30, 2023 | -30.95 |
| October 31, 2023 | -38.49 |
| September 30, 2023 | -19.22 |
| August 31, 2023 | -12.68 |
| July 31, 2023 | -22.18 |
| June 30, 2023 | -43.01 |
| May 31, 2023 | -22.18 |
| April 30, 2023 | -34.62 |
| March 31, 2023 | -6.143 |
| February 28, 2023 | -5.119 |
| January 31, 2023 | -16.19 |
| December 31, 2022 | -33.46 |
| November 30, 2022 | -24.02 |
| October 31, 2022 | -25.99 |
| September 30, 2022 | -25.88 |
| August 31, 2022 | -29.03 |
| July 31, 2022 | -34.14 |
| June 30, 2022 | -12.66 |
| May 31, 2022 | -5.417 |
| April 30, 2022 | 1.743 |
News
Headline
Time (ET)
05/13 06:37
05/08 13:15
05/04 06:14
Basic Info
|
Chicago Fed Survey of Economic Conditions Activity Index is at a current level of 11.51, down from 19.72 last month and up from 2.510 one year ago. This is a change of -41.62% from last month and 358.5% from one year ago. |
| Region | N/A |
| Source | Federal Reserve Bank of Chicago |
Stats
| Last Value | 11.51 |
| Latest Period | May 2026 |
| Last Updated | May 22 2026, 10:05 EDT |
| Next Release | Jun 23 2026, 10:00 EDT |
| Average Growth Rate | -869.3% |
| Value from Last Month | 19.72 |
| Change from Last Month | -41.62% |
| Value from 1 Year Ago | 2.510 |
| Change from 1 Year Ago | 358.5% |
| Frequency | Monthly |
| Adjustment | N/A |
| Download Source File | |
| Notes | Following the April 15, 2020, release, the CFSBC will move to a monthly release schedule. The next CFSBC results will be released at 10:00 a.m. ET on May 12, 2020, with data for April 2020. |