

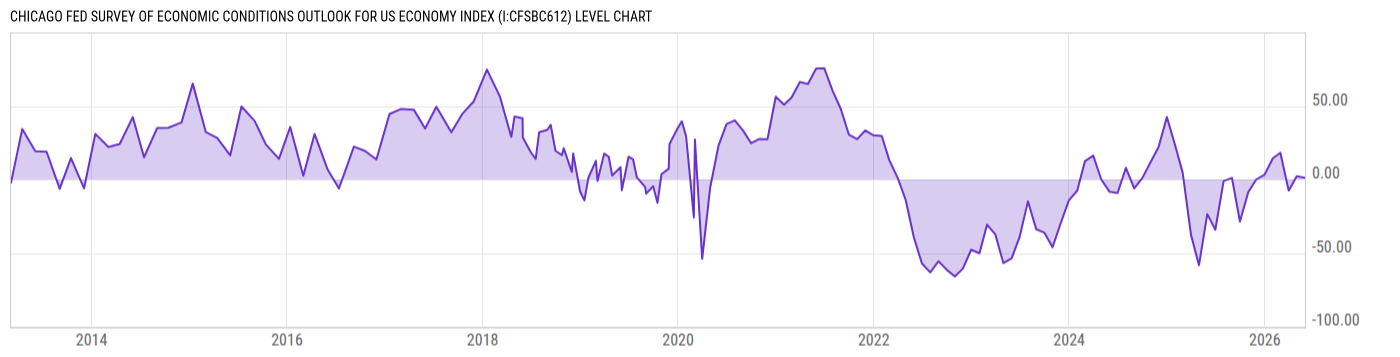
Chicago Fed Survey of Economic Conditions Outlook for US Economy Index (I:CFSBC612)
1.143 for May 2026
Level Chart
Basic Info
|
Chicago Fed Survey of Economic Conditions Outlook for US Economy Index is at a current level of 1.143, down from 2.247 last month and up from -23.55 one year ago. This is a change of -49.14% from last month. |
| Region | N/A |
| Source | Federal Reserve Bank of Chicago |
Stats
| Last Value | 1.143 |
| Latest Period | May 2026 |
| Last Updated | May 22 2026, 10:05 EDT |
| Next Release | Jun 23 2026, 10:00 EDT |
| Average Growth Rate | -740.2% |
| Value from Last Month | 2.247 |
| Change from Last Month | -49.14% |
| Value from 1 Year Ago | -23.55 |
| Change from 1 Year Ago | N/A |
| Frequency | Monthly |
| Adjustment | N/A |
| Download Source File | |
| Notes | For the next 6 to 12 months |
Historical Data
| Date | Value |
|---|---|
| May 31, 2026 | 1.143 |
| April 30, 2026 | 2.247 |
| March 31, 2026 | -7.581 |
| February 28, 2026 | 18.18 |
| January 31, 2026 | 14.44 |
| December 31, 2025 | 3.285 |
| November 30, 2025 | 0.00 |
| October 31, 2025 | -8.696 |
| September 30, 2025 | -28.57 |
| August 31, 2025 | 1.095 |
| July 31, 2025 | -1.071 |
| June 30, 2025 | -34.16 |
| May 31, 2025 | -23.55 |
| April 30, 2025 | -58.28 |
| March 31, 2025 | -37.50 |
| February 28, 2025 | 4.688 |
| January 31, 2025 | 23.08 |
| December 31, 2024 | 42.57 |
| November 30, 2024 | 22.07 |
| October 31, 2024 | 11.76 |
| September 30, 2024 | 0.9554 |
| August 31, 2024 | -6.040 |
| July 31, 2024 | 7.973 |
| June 30, 2024 | -9.215 |
| May 31, 2024 | -8.392 |
| Date | Value |
|---|---|
| April 30, 2024 | 0.00 |
| March 31, 2024 | 16.27 |
| February 29, 2024 | 12.50 |
| January 31, 2024 | -7.668 |
| December 31, 2023 | -14.19 |
| November 30, 2023 | -29.90 |
| October 31, 2023 | -46.01 |
| September 30, 2023 | -36.10 |
| August 31, 2023 | -33.82 |
| July 31, 2023 | -14.87 |
| June 30, 2023 | -39.02 |
| May 31, 2023 | -53.67 |
| April 30, 2023 | -56.85 |
| March 31, 2023 | -37.29 |
| February 28, 2023 | -30.75 |
| January 31, 2023 | -50.15 |
| December 31, 2022 | -47.77 |
| November 30, 2022 | -60.61 |
| October 31, 2022 | -66.04 |
| September 30, 2022 | -61.32 |
| August 31, 2022 | -55.61 |
| July 31, 2022 | -63.22 |
| June 30, 2022 | -57.16 |
| May 31, 2022 | -39.42 |
| April 30, 2022 | -13.78 |
News
Headline
Time (ET)
05/28 10:40
05/25 09:56
05/13 06:37
05/08 13:15
05/04 06:14
Basic Info
|
Chicago Fed Survey of Economic Conditions Outlook for US Economy Index is at a current level of 1.143, down from 2.247 last month and up from -23.55 one year ago. This is a change of -49.14% from last month. |
| Region | N/A |
| Source | Federal Reserve Bank of Chicago |
Stats
| Last Value | 1.143 |
| Latest Period | May 2026 |
| Last Updated | May 22 2026, 10:05 EDT |
| Next Release | Jun 23 2026, 10:00 EDT |
| Average Growth Rate | -740.2% |
| Value from Last Month | 2.247 |
| Change from Last Month | -49.14% |
| Value from 1 Year Ago | -23.55 |
| Change from 1 Year Ago | N/A |
| Frequency | Monthly |
| Adjustment | N/A |
| Download Source File | |
| Notes | For the next 6 to 12 months |