

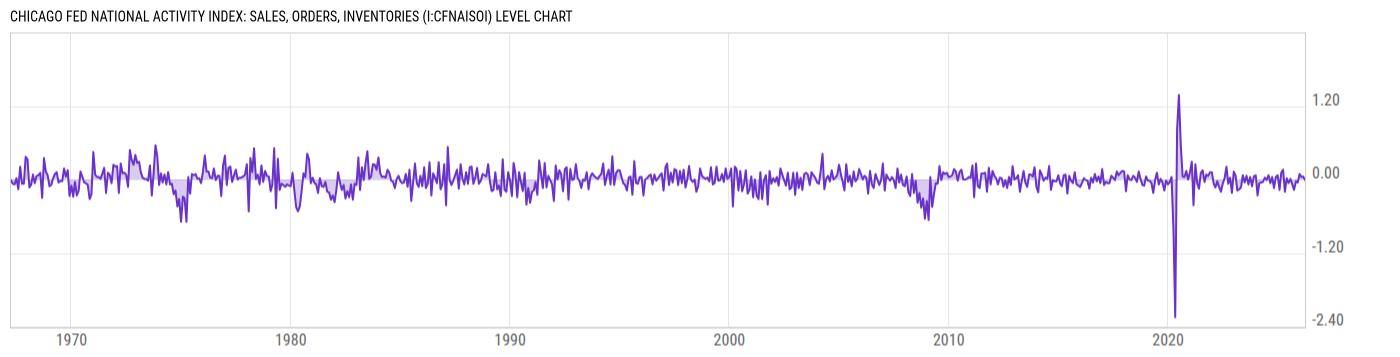
Chicago Fed National Activity Index: Sales, Orders, Inventories (I:CFNAISOI)
-0.01 for Mar 2026
Level Chart
Basic Info
|
Chicago Fed National Activity Index: Sales, Orders, Inventories is at a current level of -0.01, down from 0.05 last month and down from 0.16 one year ago. This is a change of N/A from last month. |
| Region | N/A |
| Source | Federal Reserve Bank of Chicago |
Stats
| Last Value | -0.01 |
| Latest Period | Mar 2026 |
| Last Updated | Apr 23 2026, 08:30 EDT |
| Next Release | May 26 2026, 08:30 EDT |
| Average Growth Rate | -1.14K% |
| Value from Last Month | 0.05 |
| Change from Last Month | N/A |
| Value from 1 Year Ago | 0.16 |
| Change from 1 Year Ago | N/A |
| Frequency | Monthly |
| Adjustment | N/A |
| Download Source File | |
| Notes | A zero value for the index indicates that the national economy is expanding at its historical trend rate of growth; negative values indicate below-average growth; and positive values indicate above-average growth. |
Historical Data
| Date | Value |
|---|---|
| March 31, 2026 | -0.01 |
| February 28, 2026 | 0.05 |
| January 31, 2026 | 0.04 |
| December 31, 2025 | 0.09 |
| November 30, 2025 | -0.05 |
| October 31, 2025 | -0.03 |
| September 30, 2025 | -0.17 |
| August 31, 2025 | -0.08 |
| July 31, 2025 | 0.01 |
| June 30, 2025 | -0.06 |
| May 31, 2025 | 0.02 |
| April 30, 2025 | -0.20 |
| March 31, 2025 | 0.16 |
| February 28, 2025 | 0.11 |
| January 31, 2025 | -0.17 |
| December 31, 2024 | 0.07 |
| November 30, 2024 | 0.04 |
| October 31, 2024 | -0.14 |
| September 30, 2024 | 0.04 |
| August 31, 2024 | -0.06 |
| July 31, 2024 | 0.07 |
| June 30, 2024 | -0.01 |
| May 31, 2024 | 0.03 |
| April 30, 2024 | -0.04 |
| March 31, 2024 | -0.05 |
| Date | Value |
|---|---|
| February 29, 2024 | -0.06 |
| January 31, 2024 | -0.26 |
| December 31, 2023 | 0.07 |
| November 30, 2023 | 0.05 |
| October 31, 2023 | -0.11 |
| September 30, 2023 | 0.04 |
| August 31, 2023 | -0.08 |
| July 31, 2023 | 0.06 |
| June 30, 2023 | -0.05 |
| May 31, 2023 | 0.07 |
| April 30, 2023 | -0.13 |
| March 31, 2023 | -0.16 |
| February 28, 2023 | -0.18 |
| January 31, 2023 | 0.06 |
| December 31, 2022 | 0.13 |
| November 30, 2022 | -0.22 |
| October 31, 2022 | 0.03 |
| September 30, 2022 | -0.07 |
| August 31, 2022 | 0.21 |
| July 31, 2022 | 0.02 |
| June 30, 2022 | -0.07 |
| May 31, 2022 | -0.20 |
| April 30, 2022 | -0.12 |
| March 31, 2022 | -0.03 |
| February 28, 2022 | -0.13 |
News
Headline
Time (ET)
05/01 12:49
04/20 07:46
Basic Info
|
Chicago Fed National Activity Index: Sales, Orders, Inventories is at a current level of -0.01, down from 0.05 last month and down from 0.16 one year ago. This is a change of N/A from last month. |
| Region | N/A |
| Source | Federal Reserve Bank of Chicago |
Stats
| Last Value | -0.01 |
| Latest Period | Mar 2026 |
| Last Updated | Apr 23 2026, 08:30 EDT |
| Next Release | May 26 2026, 08:30 EDT |
| Average Growth Rate | -1.14K% |
| Value from Last Month | 0.05 |
| Change from Last Month | N/A |
| Value from 1 Year Ago | 0.16 |
| Change from 1 Year Ago | N/A |
| Frequency | Monthly |
| Adjustment | N/A |
| Download Source File | |
| Notes | A zero value for the index indicates that the national economy is expanding at its historical trend rate of growth; negative values indicate below-average growth; and positive values indicate above-average growth. |