

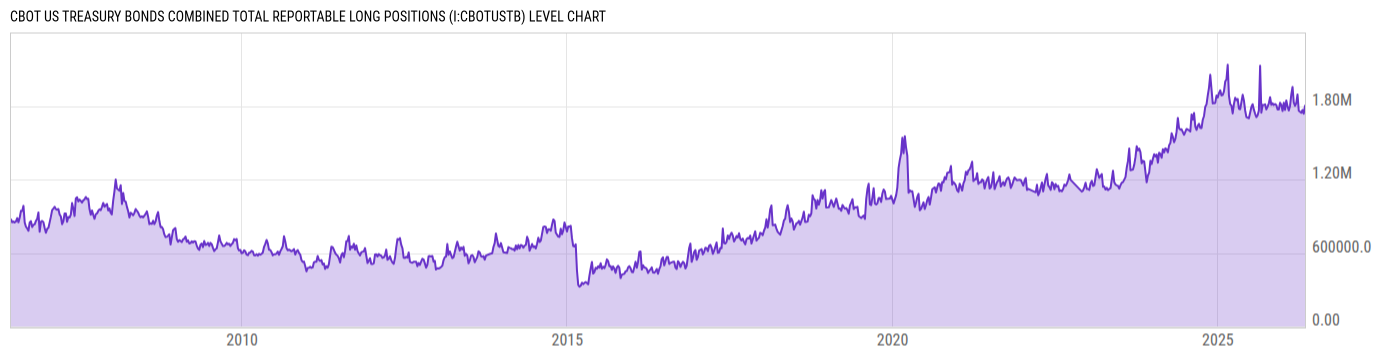
CBOT US Treasury Bonds Combined Total Reportable Long Positions (I:CBOTUSTB)
1.906M for Wk of May 26 2026
Level Chart
Basic Info
|
CBOT US Treasury Bonds Combined Total Reportable Long Positions is at a current level of 1.906M, down from 1.948M last week and up from 1.891M one year ago. This is a change of -2.14% from last week and 0.79% from one year ago. |
| Report | Commitments of Traders |
| Category | Market Indices and Statistics |
| Region | N/A |
| Source | US Commodity Futures Trading Commission |
Stats
| Last Value | 1.906M |
| Latest Period | May 26 2026 |
| Last Updated | May 29 2026, 15:36 EDT |
| Next Release | Jun 5 2026, 15:30 EDT |
| Average Growth Rate | 12.41% |
| Value from Last Week | 1.948M |
| Change from Last Week | -2.14% |
| Value from 1 Year Ago | 1.891M |
| Change from 1 Year Ago | 0.79% |
| Frequency | Weekly |
| Adjustment | N/A |
| Download Source File |
Historical Data
| Date | Value |
|---|---|
| May 26, 2026 | 1.906M |
| May 19, 2026 | 1.948M |
| May 12, 2026 | 1.816M |
| May 05, 2026 | 1.803M |
| April 28, 2026 | 1.737M |
| April 21, 2026 | 1.768M |
| April 14, 2026 | 1.744M |
| April 07, 2026 | 1.754M |
| March 31, 2026 | 1.762M |
| March 24, 2026 | 1.894M |
| March 17, 2026 | 1.824M |
| March 10, 2026 | 1.802M |
| March 03, 2026 | 1.829M |
| February 24, 2026 | 1.956M |
| February 17, 2026 | 1.892M |
| February 10, 2026 | 1.801M |
| February 03, 2026 | 1.763M |
| January 27, 2026 | 1.797M |
| January 20, 2026 | 1.845M |
| January 13, 2026 | 1.768M |
| January 06, 2026 | 1.827M |
| December 30, 2025 | 1.759M |
| December 23, 2025 | 1.809M |
| December 16, 2025 | 1.827M |
| December 09, 2025 | 1.772M |
| Date | Value |
|---|---|
| December 02, 2025 | 1.771M |
| November 25, 2025 | 1.808M |
| November 18, 2025 | 1.816M |
| November 10, 2025 | 1.808M |
| November 04, 2025 | 1.822M |
| October 28, 2025 | 1.810M |
| October 21, 2025 | 1.872M |
| October 14, 2025 | 1.822M |
| October 07, 2025 | 1.796M |
| September 30, 2025 | 1.772M |
| September 23, 2025 | 1.814M |
| September 16, 2025 | 1.808M |
| September 09, 2025 | 1.809M |
| September 02, 2025 | 1.745M |
| August 26, 2025 | 2.128M |
| August 19, 2025 | 1.762M |
| August 12, 2025 | 1.725M |
| August 05, 2025 | 1.709M |
| July 29, 2025 | 1.736M |
| July 22, 2025 | 1.770M |
| July 15, 2025 | 1.814M |
| July 08, 2025 | 1.792M |
| July 01, 2025 | 1.754M |
| June 24, 2025 | 1.700M |
| June 17, 2025 | 1.728M |
News
Headline
Time (ET)
05/29 07:59
05/26 08:53
05/22 07:53
05/20 06:48
Basic Info
|
CBOT US Treasury Bonds Combined Total Reportable Long Positions is at a current level of 1.906M, down from 1.948M last week and up from 1.891M one year ago. This is a change of -2.14% from last week and 0.79% from one year ago. |
| Report | Commitments of Traders |
| Category | Market Indices and Statistics |
| Region | N/A |
| Source | US Commodity Futures Trading Commission |
Stats
| Last Value | 1.906M |
| Latest Period | May 26 2026 |
| Last Updated | May 29 2026, 15:36 EDT |
| Next Release | Jun 5 2026, 15:30 EDT |
| Average Growth Rate | 12.41% |
| Value from Last Week | 1.948M |
| Change from Last Week | -2.14% |
| Value from 1 Year Ago | 1.891M |
| Change from 1 Year Ago | 0.79% |
| Frequency | Weekly |
| Adjustment | N/A |
| Download Source File |