

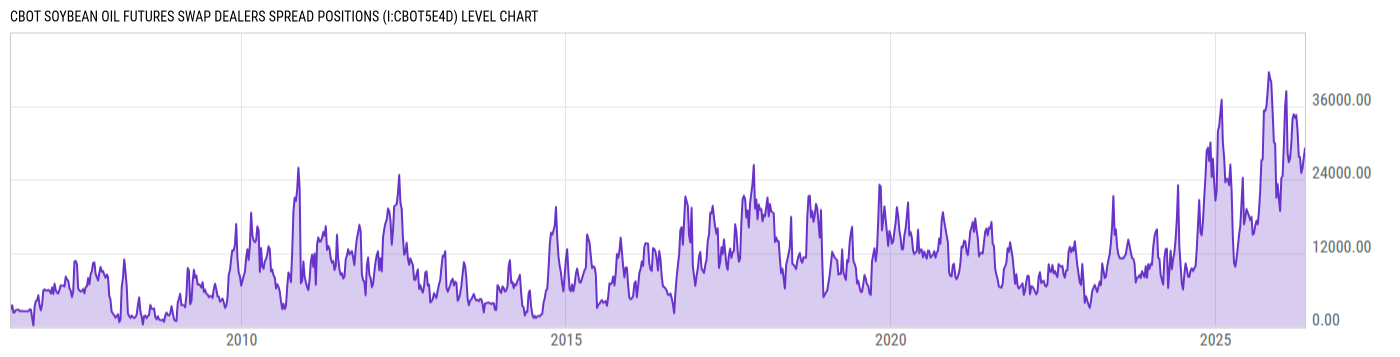
CBOT Soybean Oil Futures Swap Dealers Spread Positions (I:CBOT5E4D)
29077.00 for Wk of May 19 2026
Level Chart
Basic Info
|
CBOT Soybean Oil Futures Swap Dealers Spread Positions is at a current level of 29077.00, up from 27494.00 last week and up from 14945.00 one year ago. This is a change of 5.76% from last week and 94.56% from one year ago. |
| Report | Commitments of Traders |
| Category | Market Indices and Statistics |
| Region | N/A |
| Source | US Commodity Futures Trading Commission |
Stats
| Last Value | 29077.00 |
| Latest Period | May 19 2026 |
| Last Updated | May 22 2026, 15:48 EDT |
| Next Release | May 29 2026, 15:30 EDT |
| Average Growth Rate | 275.9% |
| Value from Last Week | 27494.00 |
| Change from Last Week | 5.76% |
| Value from 1 Year Ago | 14945.00 |
| Change from 1 Year Ago | 94.56% |
| Frequency | Weekly |
| Adjustment | N/A |
| Download Source File |
Historical Data
| Date | Value |
|---|---|
| May 19, 2026 | 29077.00 |
| May 12, 2026 | 27494.00 |
| May 05, 2026 | 25867.00 |
| April 28, 2026 | 25060.00 |
| April 21, 2026 | 27677.00 |
| April 14, 2026 | 27710.00 |
| April 07, 2026 | 32057.00 |
| March 31, 2026 | 34514.00 |
| March 24, 2026 | 34044.00 |
| March 17, 2026 | 34637.00 |
| March 10, 2026 | 33961.00 |
| March 03, 2026 | 29883.00 |
| February 24, 2026 | 27457.00 |
| February 17, 2026 | 26844.00 |
| February 10, 2026 | 28322.00 |
| February 03, 2026 | 38416.00 |
| January 27, 2026 | 35792.00 |
| January 20, 2026 | 29539.00 |
| January 13, 2026 | 24582.00 |
| January 06, 2026 | 24259.00 |
| December 30, 2025 | 18869.00 |
| December 23, 2025 | 20973.00 |
| December 16, 2025 | 23252.00 |
| December 09, 2025 | 21007.00 |
| December 02, 2025 | 29879.00 |
| Date | Value |
|---|---|
| November 25, 2025 | 30069.00 |
| November 18, 2025 | 35006.00 |
| November 10, 2025 | 40032.00 |
| November 04, 2025 | 40435.00 |
| October 28, 2025 | 41522.00 |
| October 21, 2025 | 38416.00 |
| October 14, 2025 | 35939.00 |
| October 07, 2025 | 35178.00 |
| September 30, 2025 | 35254.00 |
| September 23, 2025 | 27295.00 |
| September 16, 2025 | 27170.00 |
| September 09, 2025 | 22149.00 |
| September 02, 2025 | 18837.00 |
| August 26, 2025 | 16675.00 |
| August 19, 2025 | 17264.00 |
| August 12, 2025 | 16458.00 |
| August 05, 2025 | 15223.00 |
| July 29, 2025 | 14988.00 |
| July 22, 2025 | 17877.00 |
| July 15, 2025 | 17369.00 |
| July 08, 2025 | 18089.00 |
| July 01, 2025 | 18574.00 |
| June 24, 2025 | 19193.00 |
| June 17, 2025 | 17740.00 |
| June 10, 2025 | 16695.00 |
News
Headline
Time (ET)
05/22 07:53
05/20 06:48
05/15 08:06
05/14 08:05
05/05 08:06
Basic Info
|
CBOT Soybean Oil Futures Swap Dealers Spread Positions is at a current level of 29077.00, up from 27494.00 last week and up from 14945.00 one year ago. This is a change of 5.76% from last week and 94.56% from one year ago. |
| Report | Commitments of Traders |
| Category | Market Indices and Statistics |
| Region | N/A |
| Source | US Commodity Futures Trading Commission |
Stats
| Last Value | 29077.00 |
| Latest Period | May 19 2026 |
| Last Updated | May 22 2026, 15:48 EDT |
| Next Release | May 29 2026, 15:30 EDT |
| Average Growth Rate | 275.9% |
| Value from Last Week | 27494.00 |
| Change from Last Week | 5.76% |
| Value from 1 Year Ago | 14945.00 |
| Change from 1 Year Ago | 94.56% |
| Frequency | Weekly |
| Adjustment | N/A |
| Download Source File |