

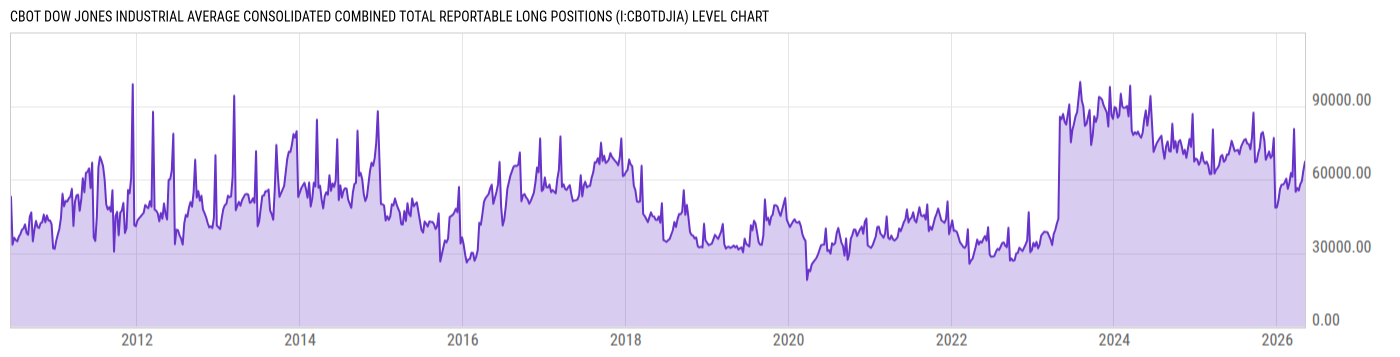
CBOT Dow Jones Industrial Average Consolidated Combined Total Reportable Long Positions (I:CBOTDJIA)
71132.00 for Wk of May 26 2026
Level Chart
Basic Info
|
CBOT Dow Jones Industrial Average Consolidated Combined Total Reportable Long Positions is at a current level of 71132.00, down from 75024.00 last week and up from 70192.00 one year ago. This is a change of -5.19% from last week and 1.34% from one year ago. |
| Report | Commitments of Traders |
| Category | Market Indices and Statistics |
| Region | N/A |
| Source | US Commodity Futures Trading Commission |
Stats
| Last Value | 71132.00 |
| Latest Period | May 26 2026 |
| Last Updated | May 29 2026, 15:34 EDT |
| Next Release | Jun 5 2026, 15:30 EDT |
| Average Growth Rate | 49.72% |
| Value from Last Week | 75024.00 |
| Change from Last Week | -5.19% |
| Value from 1 Year Ago | 70192.00 |
| Change from 1 Year Ago | 1.34% |
| Frequency | Weekly |
| Adjustment | N/A |
| Download Source File |
Historical Data
| Date | Value |
|---|---|
| May 26, 2026 | 71132.00 |
| May 19, 2026 | 75024.00 |
| May 12, 2026 | 73277.00 |
| May 05, 2026 | 67262.00 |
| April 28, 2026 | 63828.00 |
| April 21, 2026 | 59402.00 |
| April 14, 2026 | 58126.00 |
| April 07, 2026 | 55491.00 |
| March 31, 2026 | 56515.00 |
| March 24, 2026 | 54982.00 |
| March 17, 2026 | 80565.00 |
| March 10, 2026 | 61090.00 |
| March 03, 2026 | 62658.00 |
| February 24, 2026 | 58676.00 |
| February 17, 2026 | 56217.00 |
| February 10, 2026 | 60306.00 |
| February 03, 2026 | 58783.00 |
| January 27, 2026 | 57936.00 |
| January 20, 2026 | 57874.00 |
| January 13, 2026 | 56132.00 |
| January 06, 2026 | 51506.00 |
| December 30, 2025 | 48648.00 |
| December 23, 2025 | 48517.00 |
| December 16, 2025 | 76916.00 |
| December 09, 2025 | 69744.00 |
| Date | Value |
|---|---|
| December 02, 2025 | 68803.00 |
| November 25, 2025 | 71424.00 |
| November 18, 2025 | 69680.00 |
| November 10, 2025 | 68064.00 |
| November 04, 2025 | 75799.00 |
| October 28, 2025 | 79338.00 |
| October 21, 2025 | 78690.00 |
| October 14, 2025 | 72970.00 |
| October 07, 2025 | 70652.00 |
| September 30, 2025 | 67272.00 |
| September 23, 2025 | 67023.00 |
| September 16, 2025 | 87286.00 |
| September 09, 2025 | 76996.00 |
| September 02, 2025 | 72347.00 |
| August 26, 2025 | 74469.00 |
| August 19, 2025 | 74644.00 |
| August 12, 2025 | 76471.00 |
| August 05, 2025 | 76065.00 |
| July 29, 2025 | 74715.00 |
| July 22, 2025 | 73307.00 |
| July 15, 2025 | 70295.00 |
| July 08, 2025 | 72112.00 |
| July 01, 2025 | 75034.00 |
| June 24, 2025 | 71563.00 |
| June 17, 2025 | 90937.00 |
News
Headline
Time (ET)
05/29 07:59
05/26 08:53
05/22 07:53
05/20 06:48
Basic Info
|
CBOT Dow Jones Industrial Average Consolidated Combined Total Reportable Long Positions is at a current level of 71132.00, down from 75024.00 last week and up from 70192.00 one year ago. This is a change of -5.19% from last week and 1.34% from one year ago. |
| Report | Commitments of Traders |
| Category | Market Indices and Statistics |
| Region | N/A |
| Source | US Commodity Futures Trading Commission |
Stats
| Last Value | 71132.00 |
| Latest Period | May 26 2026 |
| Last Updated | May 29 2026, 15:34 EDT |
| Next Release | Jun 5 2026, 15:30 EDT |
| Average Growth Rate | 49.72% |
| Value from Last Week | 75024.00 |
| Change from Last Week | -5.19% |
| Value from 1 Year Ago | 70192.00 |
| Change from 1 Year Ago | 1.34% |
| Frequency | Weekly |
| Adjustment | N/A |
| Download Source File |