

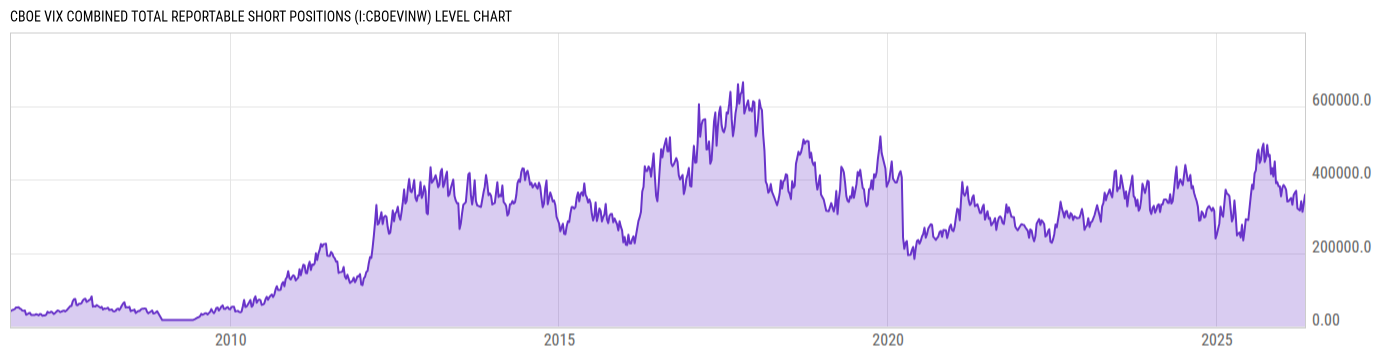
CBOE VIX Combined Total Reportable Short Positions (I:CBOEVINW)
358781.0 for Wk of May 05 2026
Level Chart
Basic Info
|
CBOE VIX Combined Total Reportable Short Positions is at a current level of 358781.0, up from 333699.0 last week and up from 253005.0 one year ago. This is a change of 7.52% from last week and 41.81% from one year ago. |
| Report | Commitments of Traders |
| Category | Market Indices and Statistics |
| Region | N/A |
| Source | US Commodity Futures Trading Commission |
Stats
| Last Value | 358781.0 |
| Latest Period | May 05 2026 |
| Last Updated | May 8 2026, 15:31 EDT |
| Next Release | May 15 2026, 15:30 EDT |
| Average Growth Rate | 31.84% |
| Value from Last Week | 333699.0 |
| Change from Last Week | 7.52% |
| Value from 1 Year Ago | 253005.0 |
| Change from 1 Year Ago | 41.81% |
| Frequency | Weekly |
| Adjustment | N/A |
| Download Source File |
Historical Data
| Date | Value |
|---|---|
| May 05, 2026 | 358781.0 |
| April 28, 2026 | 333699.0 |
| April 21, 2026 | 312211.0 |
| April 14, 2026 | 340620.0 |
| April 07, 2026 | 315860.0 |
| March 31, 2026 | 318632.0 |
| March 24, 2026 | 320970.0 |
| March 17, 2026 | 369215.0 |
| March 10, 2026 | 364389.0 |
| March 03, 2026 | 357660.0 |
| February 24, 2026 | 330996.0 |
| February 17, 2026 | 349487.0 |
| February 10, 2026 | 345910.0 |
| February 03, 2026 | 340919.0 |
| January 27, 2026 | 339920.0 |
| January 20, 2026 | 372603.0 |
| January 13, 2026 | 379912.0 |
| January 06, 2026 | 384942.0 |
| December 30, 2025 | 377383.0 |
| December 23, 2025 | 354217.0 |
| December 16, 2025 | 381718.0 |
| December 09, 2025 | 381508.0 |
| December 02, 2025 | 393116.0 |
| November 25, 2025 | 389796.0 |
| November 18, 2025 | 449118.0 |
| Date | Value |
|---|---|
| November 10, 2025 | 408196.0 |
| November 04, 2025 | 430953.0 |
| October 28, 2025 | 414639.0 |
| October 21, 2025 | 466949.0 |
| October 14, 2025 | 462933.0 |
| October 07, 2025 | 494031.0 |
| September 30, 2025 | 458875.0 |
| September 23, 2025 | 447911.0 |
| September 16, 2025 | 497495.0 |
| September 09, 2025 | 484692.0 |
| September 02, 2025 | 453712.0 |
| August 26, 2025 | 445054.0 |
| August 19, 2025 | 481144.0 |
| August 12, 2025 | 467808.0 |
| August 05, 2025 | 424592.0 |
| July 29, 2025 | 416593.0 |
| July 22, 2025 | 374179.0 |
| July 15, 2025 | 385530.0 |
| July 08, 2025 | 356389.0 |
| June 24, 2025 | 289757.0 |
| June 10, 2025 | 291667.0 |
| June 03, 2025 | 259243.0 |
| May 27, 2025 | 234192.0 |
| May 20, 2025 | 277096.0 |
| May 13, 2025 | 242287.0 |
News
Headline
Time (ET)
05/05 08:06
Basic Info
|
CBOE VIX Combined Total Reportable Short Positions is at a current level of 358781.0, up from 333699.0 last week and up from 253005.0 one year ago. This is a change of 7.52% from last week and 41.81% from one year ago. |
| Report | Commitments of Traders |
| Category | Market Indices and Statistics |
| Region | N/A |
| Source | US Commodity Futures Trading Commission |
Stats
| Last Value | 358781.0 |
| Latest Period | May 05 2026 |
| Last Updated | May 8 2026, 15:31 EDT |
| Next Release | May 15 2026, 15:30 EDT |
| Average Growth Rate | 31.84% |
| Value from Last Week | 333699.0 |
| Change from Last Week | 7.52% |
| Value from 1 Year Ago | 253005.0 |
| Change from 1 Year Ago | 41.81% |
| Frequency | Weekly |
| Adjustment | N/A |
| Download Source File |