

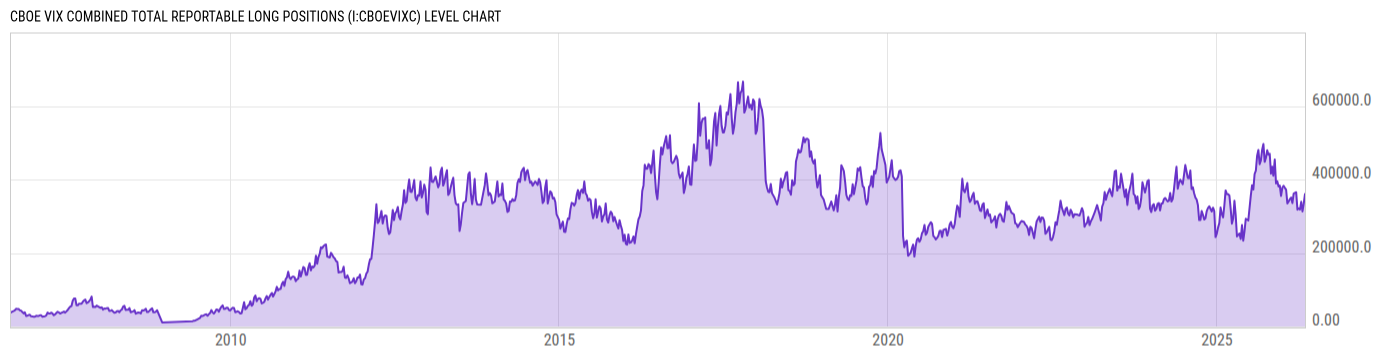
CBOE VIX Combined Total Reportable Long Positions (I:CBOEVIXC)
361728.0 for Wk of May 26 2026
Level Chart
Basic Info
|
CBOE VIX Combined Total Reportable Long Positions is at a current level of 361728.0, down from 411213.0 last week and up from 275935.0 one year ago. This is a change of -12.03% from last week and 31.09% from one year ago. |
| Report | Commitments of Traders |
| Category | Market Indices and Statistics |
| Region | N/A |
| Source | US Commodity Futures Trading Commission |
Stats
| Last Value | 361728.0 |
| Latest Period | May 26 2026 |
| Last Updated | May 29 2026, 15:36 EDT |
| Next Release | Jun 5 2026, 15:30 EDT |
| Average Growth Rate | 33.22% |
| Value from Last Week | 411213.0 |
| Change from Last Week | -12.03% |
| Value from 1 Year Ago | 275935.0 |
| Change from 1 Year Ago | 31.09% |
| Frequency | Weekly |
| Adjustment | N/A |
| Download Source File |
Historical Data
| Date | Value |
|---|---|
| May 26, 2026 | 361728.0 |
| May 19, 2026 | 411213.0 |
| May 12, 2026 | 377069.0 |
| May 05, 2026 | 360582.0 |
| April 28, 2026 | 334231.0 |
| April 21, 2026 | 313196.0 |
| April 14, 2026 | 339338.0 |
| April 07, 2026 | 318038.0 |
| March 31, 2026 | 321445.0 |
| March 24, 2026 | 317953.0 |
| March 17, 2026 | 365476.0 |
| March 10, 2026 | 363847.0 |
| March 03, 2026 | 361795.0 |
| February 24, 2026 | 335747.0 |
| February 17, 2026 | 350762.0 |
| February 10, 2026 | 346559.0 |
| February 03, 2026 | 339993.0 |
| January 27, 2026 | 334821.0 |
| January 20, 2026 | 372707.0 |
| January 13, 2026 | 377323.0 |
| January 06, 2026 | 382826.0 |
| December 30, 2025 | 377349.0 |
| December 23, 2025 | 355363.0 |
| December 16, 2025 | 383222.0 |
| December 09, 2025 | 380822.0 |
| Date | Value |
|---|---|
| December 02, 2025 | 395165.0 |
| November 25, 2025 | 389225.0 |
| November 18, 2025 | 454231.0 |
| November 10, 2025 | 410280.0 |
| November 04, 2025 | 434526.0 |
| October 28, 2025 | 415821.0 |
| October 21, 2025 | 470165.0 |
| October 14, 2025 | 467097.0 |
| October 07, 2025 | 479374.0 |
| September 30, 2025 | 459063.0 |
| September 23, 2025 | 448048.0 |
| September 16, 2025 | 496372.0 |
| September 09, 2025 | 481145.0 |
| September 02, 2025 | 452094.0 |
| August 26, 2025 | 441434.0 |
| August 19, 2025 | 480559.0 |
| August 12, 2025 | 465042.0 |
| August 05, 2025 | 424045.0 |
| July 29, 2025 | 414975.0 |
| July 22, 2025 | 372537.0 |
| July 15, 2025 | 384621.0 |
| July 08, 2025 | 356834.0 |
| July 01, 2025 | 335707.0 |
| June 24, 2025 | 288733.0 |
| June 17, 2025 | 303534.0 |
News
Headline
Time (ET)
05/29 07:59
05/26 08:53
05/22 07:53
05/20 06:48
Basic Info
|
CBOE VIX Combined Total Reportable Long Positions is at a current level of 361728.0, down from 411213.0 last week and up from 275935.0 one year ago. This is a change of -12.03% from last week and 31.09% from one year ago. |
| Report | Commitments of Traders |
| Category | Market Indices and Statistics |
| Region | N/A |
| Source | US Commodity Futures Trading Commission |
Stats
| Last Value | 361728.0 |
| Latest Period | May 26 2026 |
| Last Updated | May 29 2026, 15:36 EDT |
| Next Release | Jun 5 2026, 15:30 EDT |
| Average Growth Rate | 33.22% |
| Value from Last Week | 411213.0 |
| Change from Last Week | -12.03% |
| Value from 1 Year Ago | 275935.0 |
| Change from 1 Year Ago | 31.09% |
| Frequency | Weekly |
| Adjustment | N/A |
| Download Source File |