

CBOE Total Put Volume (I:CBOETPV)
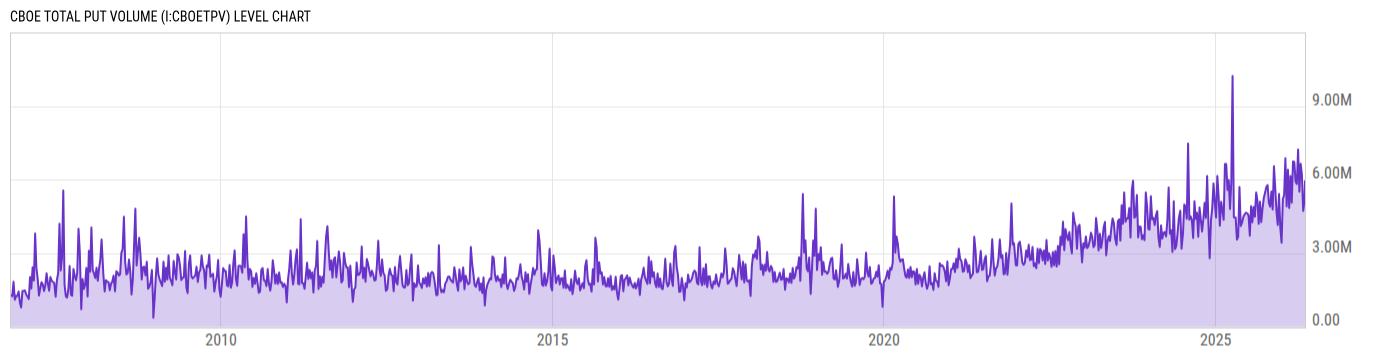
5.932M for May 08 2026
Level Chart
Basic Info
|
CBOE Total Put Volume is at a current level of 5.932M, N/A from the previous market day and up from 5.204M one year ago. This is a change of N/A from the previous market day and 13.98% from one year ago. |
| Report | CBOE Daily Market Statistics |
| Category | Market Indices and Statistics |
| Region | United States |
| Source | Chicago Board Options Exchange |
Stats
| Last Value | 5.932M |
| Latest Period | May 08 2026 |
| Last Updated | May 8 2026, 21:39 EDT |
| Next Release | May 11 2026, 20:00 EDT |
| Average Growth Rate | 724.5% |
| Value from The Previous Market Day | |
| Change from The Previous Market Day | N/A |
| Value from 1 Year Ago | 5.204M |
| Change from 1 Year Ago | 13.98% |
| Frequency | Market Daily |
| Adjustment | N/A |
| Download Source File | |
| Notes | CBOE total puts for all products. |
Historical Data
| Date | Value |
|---|---|
| May 08, 2026 | 5.932M |
| May 07, 2026 | 6.104M |
| May 06, 2026 | 6.578M |
| May 05, 2026 | 5.152M |
| May 04, 2026 | 5.782M |
| May 01, 2026 | 6.020M |
| April 30, 2026 | 5.671M |
| April 29, 2026 | 5.045M |
| April 28, 2026 | 4.714M |
| April 27, 2026 | 5.290M |
| April 24, 2026 | 6.398M |
| April 23, 2026 | 6.391M |
| April 22, 2026 | 5.075M |
| April 21, 2026 | 6.187M |
| April 20, 2026 | 5.141M |
| April 17, 2026 | 7.154M |
| April 16, 2026 | 5.978M |
| April 15, 2026 | 6.544M |
| April 14, 2026 | 6.646M |
| April 13, 2026 | 5.657M |
| April 10, 2026 | 5.888M |
| April 09, 2026 | 6.146M |
| April 08, 2026 | 7.764M |
| April 07, 2026 | 5.499M |
| April 06, 2026 | 5.136M |
| Date | Value |
|---|---|
| April 02, 2026 | 7.041M |
| April 01, 2026 | 6.847M |
| March 31, 2026 | 7.225M |
| March 30, 2026 | 6.548M |
| March 27, 2026 | 7.810M |
| March 26, 2026 | 6.470M |
| March 25, 2026 | 6.294M |
| March 24, 2026 | 5.817M |
| March 23, 2026 | 6.971M |
| March 20, 2026 | 8.518M |
| March 19, 2026 | 6.703M |
| March 18, 2026 | 6.553M |
| March 17, 2026 | 5.921M |
| March 16, 2026 | 6.780M |
| March 13, 2026 | 6.752M |
| March 12, 2026 | 6.058M |
| March 11, 2026 | 6.302M |
| March 10, 2026 | 6.717M |
| March 09, 2026 | 7.477M |
| March 06, 2026 | 7.254M |
| March 05, 2026 | 6.245M |
| March 04, 2026 | 6.102M |
| March 03, 2026 | 6.732M |
| March 02, 2026 | 6.417M |
| February 27, 2026 | 6.416M |
News
Headline
Time (ET)
05/04 08:51
05/04 08:26
05/01 10:52
04/15 06:31
04/09 06:46
04/09 06:44
Basic Info
|
CBOE Total Put Volume is at a current level of 5.932M, N/A from the previous market day and up from 5.204M one year ago. This is a change of N/A from the previous market day and 13.98% from one year ago. |
| Report | CBOE Daily Market Statistics |
| Category | Market Indices and Statistics |
| Region | United States |
| Source | Chicago Board Options Exchange |
Stats
| Last Value | 5.932M |
| Latest Period | May 08 2026 |
| Last Updated | May 8 2026, 21:39 EDT |
| Next Release | May 11 2026, 20:00 EDT |
| Average Growth Rate | 724.5% |
| Value from The Previous Market Day | |
| Change from The Previous Market Day | N/A |
| Value from 1 Year Ago | 5.204M |
| Change from 1 Year Ago | 13.98% |
| Frequency | Market Daily |
| Adjustment | N/A |
| Download Source File | |
| Notes | CBOE total puts for all products. |