

CBOE Equity Put Volume (I:CBOEEPV)
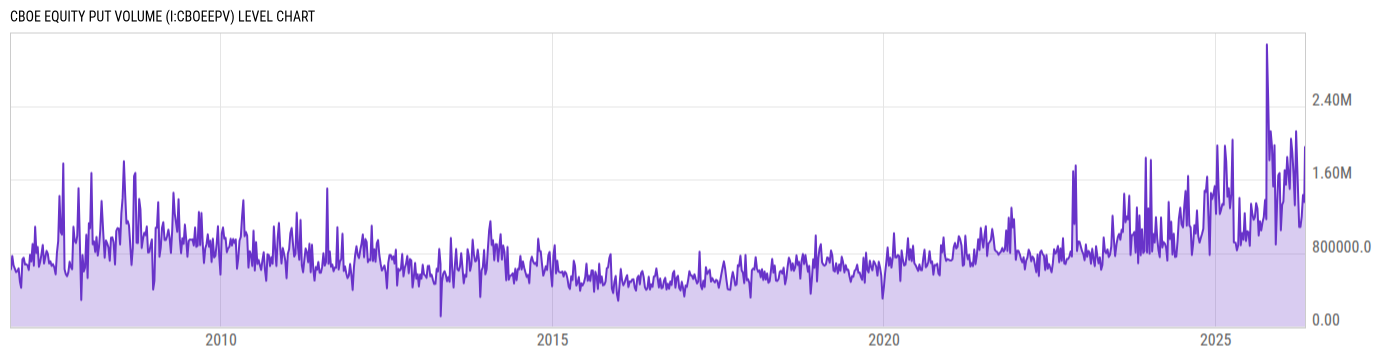
1.781M for May 29 2026
Level Chart
Basic Info
|
CBOE Equity Put Volume is at a current level of 1.781M, N/A from the previous market day and up from 1.147M one year ago. This is a change of N/A from the previous market day and 55.20% from one year ago. |
| Report | CBOE Daily Market Statistics |
| Category | Market Indices and Statistics |
| Region | United States |
| Source | Chicago Board Options Exchange |
Stats
| Last Value | 1.781M |
| Latest Period | May 29 2026 |
| Last Updated | May 29 2026, 21:25 EDT |
| Next Release | Jun 1 2026, 20:00 EDT |
| Average Growth Rate | 651.7% |
| Value from The Previous Market Day | |
| Change from The Previous Market Day | N/A |
| Value from 1 Year Ago | 1.147M |
| Change from 1 Year Ago | 55.20% |
| Frequency | Market Daily |
| Adjustment | N/A |
| Download Source File | |
| Notes | CBOE total puts for equity products. |
Historical Data
| Date | Value |
|---|---|
| May 29, 2026 | 1.781M |
| May 28, 2026 | 1.336M |
| May 27, 2026 | 1.212M |
| May 26, 2026 | 1.389M |
| May 22, 2026 | 1.760M |
| May 21, 2026 | 1.220M |
| May 20, 2026 | 1.176M |
| May 19, 2026 | 1.176M |
| May 18, 2026 | 1.479M |
| May 15, 2026 | 1.929M |
| May 14, 2026 | 1.721M |
| May 13, 2026 | 1.657M |
| May 12, 2026 | 1.376M |
| May 11, 2026 | 1.557M |
| May 08, 2026 | 1.955M |
| May 07, 2026 | 1.407M |
| May 06, 2026 | 1.842M |
| May 05, 2026 | 1.507M |
| May 04, 2026 | 1.356M |
| May 01, 2026 | 1.555M |
| April 30, 2026 | 1.305M |
| April 29, 2026 | 1.233M |
| April 28, 2026 | 1.060M |
| April 27, 2026 | 1.431M |
| April 24, 2026 | 1.924M |
| Date | Value |
|---|---|
| April 23, 2026 | 1.422M |
| April 22, 2026 | 1.231M |
| April 21, 2026 | 1.235M |
| April 20, 2026 | 1.200M |
| April 17, 2026 | 1.725M |
| April 16, 2026 | 1.301M |
| April 15, 2026 | 1.446M |
| April 14, 2026 | 1.326M |
| April 13, 2026 | 1.084M |
| April 10, 2026 | 1.328M |
| April 09, 2026 | 1.160M |
| April 08, 2026 | 1.312M |
| April 07, 2026 | 1.085M |
| April 06, 2026 | 1.084M |
| April 02, 2026 | 1.277M |
| April 01, 2026 | 1.218M |
| March 31, 2026 | 1.019M |
| March 30, 2026 | 1.287M |
| March 27, 2026 | 1.699M |
| March 26, 2026 | 1.316M |
| March 25, 2026 | 1.286M |
| March 24, 2026 | 1.162M |
| March 23, 2026 | 1.238M |
| March 20, 2026 | 2.125M |
| March 19, 2026 | 1.387M |
News
Headline
Time (ET)
05/05 07:07
05/04 08:51
05/04 08:26
05/01 10:52
Basic Info
|
CBOE Equity Put Volume is at a current level of 1.781M, N/A from the previous market day and up from 1.147M one year ago. This is a change of N/A from the previous market day and 55.20% from one year ago. |
| Report | CBOE Daily Market Statistics |
| Category | Market Indices and Statistics |
| Region | United States |
| Source | Chicago Board Options Exchange |
Stats
| Last Value | 1.781M |
| Latest Period | May 29 2026 |
| Last Updated | May 29 2026, 21:25 EDT |
| Next Release | Jun 1 2026, 20:00 EDT |
| Average Growth Rate | 651.7% |
| Value from The Previous Market Day | |
| Change from The Previous Market Day | N/A |
| Value from 1 Year Ago | 1.147M |
| Change from 1 Year Ago | 55.20% |
| Frequency | Market Daily |
| Adjustment | N/A |
| Download Source File | |
| Notes | CBOE total puts for equity products. |