

Cass Freight Shipments Index MoM (I:CFSIMM)
0.01% for Mar 2026
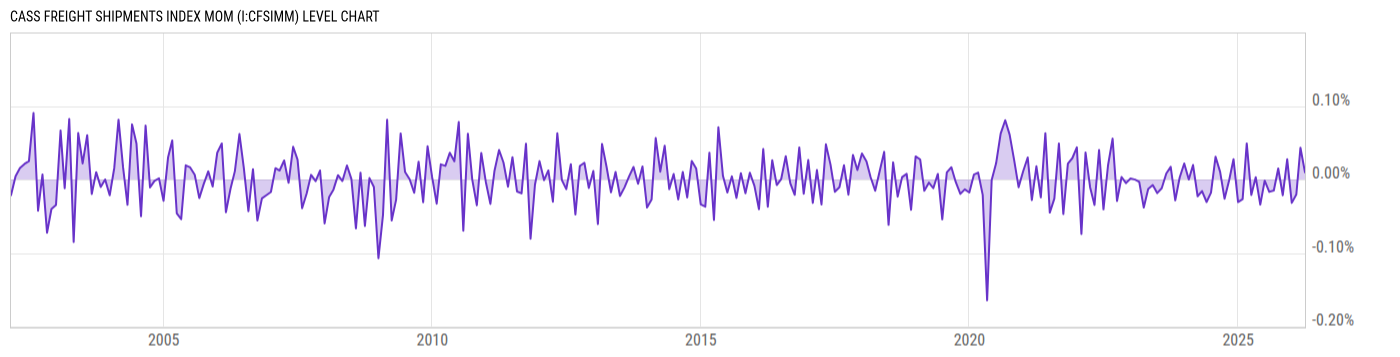
Level Chart
Basic Info
|
Cass Freight Shipments Index MoM is at 0.01%, compared to 0.04% last month and -0.02% last year. This is higher than the long term average of 0.00%. |
| Report | The Cass Freight Index |
| Category | Manufacturing Business Statistics |
| Region | United States |
| Source | Cass Information Systems, Inc |
Stats
| Last Value | 0.01% |
| Latest Period | Mar 2026 |
| Last Updated | May 13 2026, 10:04 EDT |
| Next Release | Jun 13 2026, 10:00 EDT |
| Long Term Average | 0.00% |
| Average Growth Rate | -3.16K% |
| Value from Last Month | 0.04% |
| Change from Last Month | -77.68% |
| Value from 1 Year Ago | -0.02% |
| Change from 1 Year Ago | N/A |
| Frequency | Monthly |
| Unit | Percent |
| Adjustment | Seasonally Adjusted |
| Download Source File |
Historical Data
| Date | Value |
|---|---|
| March 31, 2026 | 0.01% |
| February 28, 2026 | 0.04% |
| January 31, 2026 | -0.02% |
| December 31, 2025 | -0.03% |
| November 30, 2025 | 0.03% |
| October 31, 2025 | -0.02% |
| September 30, 2025 | 0.02% |
| August 31, 2025 | -0.01% |
| July 31, 2025 | -0.02% |
| June 30, 2025 | -0.00% |
| May 31, 2025 | -0.03% |
| April 30, 2025 | 0.00% |
| March 31, 2025 | -0.02% |
| February 28, 2025 | 0.05% |
| January 31, 2025 | -0.03% |
| December 31, 2024 | -0.03% |
| November 30, 2024 | 0.03% |
| October 31, 2024 | -0.00% |
| September 30, 2024 | -0.03% |
| August 31, 2024 | 0.01% |
| July 31, 2024 | 0.03% |
| June 30, 2024 | -0.02% |
| May 31, 2024 | -0.03% |
| April 30, 2024 | -0.02% |
| March 31, 2024 | -0.02% |
| Date | Value |
|---|---|
| February 29, 2024 | 0.02% |
| January 31, 2024 | 0.00% |
| December 31, 2023 | 0.02% |
| November 30, 2023 | 0.00% |
| October 31, 2023 | -0.03% |
| September 30, 2023 | 0.02% |
| August 31, 2023 | 0.01% |
| July 31, 2023 | -0.01% |
| June 30, 2023 | -0.02% |
| May 31, 2023 | -0.01% |
| April 30, 2023 | -0.01% |
| March 31, 2023 | -0.04% |
| February 28, 2023 | -0.00% |
| January 31, 2023 | -0.00% |
| December 31, 2022 | 0.00% |
| November 30, 2022 | -0.00% |
| October 31, 2022 | 0.00% |
| September 30, 2022 | -0.03% |
| August 31, 2022 | 0.06% |
| July 31, 2022 | 0.02% |
| June 30, 2022 | -0.04% |
| May 31, 2022 | 0.04% |
| April 30, 2022 | -0.03% |
| March 31, 2022 | -0.01% |
| February 28, 2022 | 0.04% |
News
Headline
Time (ET)
04/29 12:54
Basic Info
|
Cass Freight Shipments Index MoM is at 0.01%, compared to 0.04% last month and -0.02% last year. This is higher than the long term average of 0.00%. |
| Report | The Cass Freight Index |
| Category | Manufacturing Business Statistics |
| Region | United States |
| Source | Cass Information Systems, Inc |
Stats
| Last Value | 0.01% |
| Latest Period | Mar 2026 |
| Last Updated | May 13 2026, 10:04 EDT |
| Next Release | Jun 13 2026, 10:00 EDT |
| Long Term Average | 0.00% |
| Average Growth Rate | -3.16K% |
| Value from Last Month | 0.04% |
| Change from Last Month | -77.68% |
| Value from 1 Year Ago | -0.02% |
| Change from 1 Year Ago | N/A |
| Frequency | Monthly |
| Unit | Percent |
| Adjustment | Seasonally Adjusted |
| Download Source File |