

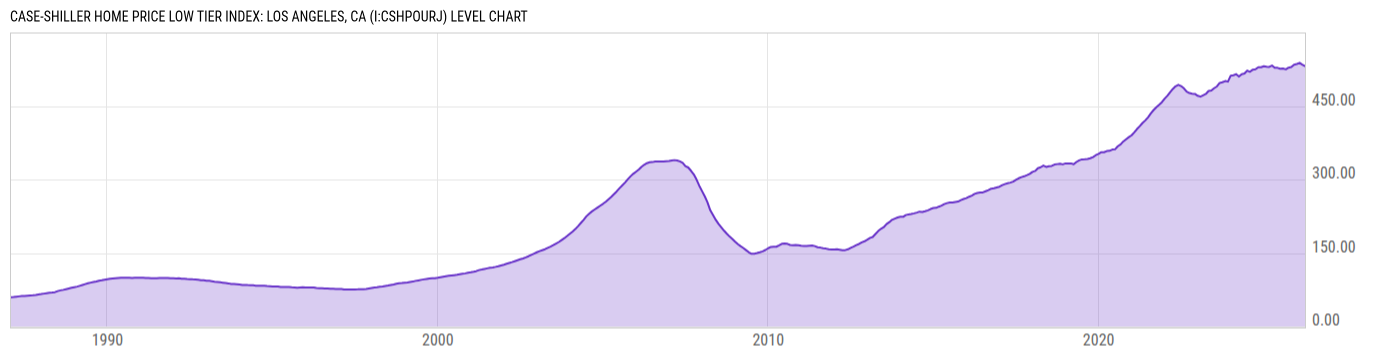
Case-Shiller Home Price Low Tier Index: Los Angeles, CA (I:CSHPOURJ)
531.47 for Mar 2026
Level Chart
Basic Info
|
Case-Shiller Home Price Low Tier Index: Los Angeles, CA is at a current level of 531.47, down from 534.50 last month and down from 532.62 one year ago. This is a change of -0.57% from last month and -0.22% from one year ago. |
| Report | Case-Shiller Home Price Index |
| Category | House Prices |
| Region | N/A |
| Source | Standard and Poor's |
Stats
| Last Value | 531.47 |
| Latest Period | Mar 2026 |
| Last Updated | Jun 1 2026, 09:43 EDT |
| Next Release | Jun 30 2026, 09:00 EDT |
| Average Growth Rate | 5.69% |
| Value from Last Month | 534.50 |
| Change from Last Month | -0.57% |
| Value from 1 Year Ago | 532.62 |
| Change from 1 Year Ago | -0.22% |
| Frequency | Monthly |
| Unit | Index January 2000=100 |
| Adjustment | Seasonally Adjusted |
| Download Source File |
Historical Data
| Date | Value |
|---|---|
| March 31, 2026 | 531.47 |
| February 28, 2026 | 534.50 |
| January 31, 2026 | 538.01 |
| December 31, 2025 | 535.72 |
| November 30, 2025 | 534.27 |
| October 31, 2025 | 529.45 |
| September 30, 2025 | 528.18 |
| August 31, 2025 | 524.79 |
| July 31, 2025 | 526.38 |
| June 30, 2025 | 525.90 |
| May 31, 2025 | 527.84 |
| April 30, 2025 | 527.95 |
| March 31, 2025 | 532.62 |
| February 28, 2025 | 529.63 |
| January 31, 2025 | 530.23 |
| December 31, 2024 | 531.18 |
| November 30, 2024 | 529.04 |
| October 31, 2024 | 529.23 |
| September 30, 2024 | 524.84 |
| August 31, 2024 | 524.16 |
| July 31, 2024 | 519.74 |
| June 30, 2024 | 522.28 |
| May 31, 2024 | 516.27 |
| April 30, 2024 | 514.74 |
| March 31, 2024 | 510.01 |
| Date | Value |
|---|---|
| February 29, 2024 | 515.04 |
| January 31, 2024 | 512.72 |
| December 31, 2023 | 511.96 |
| November 30, 2023 | 499.75 |
| October 31, 2023 | 500.90 |
| September 30, 2023 | 498.39 |
| August 31, 2023 | 497.09 |
| July 31, 2023 | 489.83 |
| June 30, 2023 | 486.21 |
| May 31, 2023 | 481.53 |
| April 30, 2023 | 480.62 |
| March 31, 2023 | 474.55 |
| February 28, 2023 | 471.66 |
| January 31, 2023 | 469.11 |
| December 31, 2022 | 470.82 |
| November 30, 2022 | 474.63 |
| October 31, 2022 | 475.18 |
| September 30, 2022 | 476.38 |
| August 31, 2022 | 479.17 |
| July 31, 2022 | 486.14 |
| June 30, 2022 | 490.68 |
| May 31, 2022 | 493.15 |
| April 30, 2022 | 490.19 |
| March 31, 2022 | 484.85 |
| February 28, 2022 | 477.86 |
News
Headline
Time (ET)
Basic Info
|
Case-Shiller Home Price Low Tier Index: Los Angeles, CA is at a current level of 531.47, down from 534.50 last month and down from 532.62 one year ago. This is a change of -0.57% from last month and -0.22% from one year ago. |
| Report | Case-Shiller Home Price Index |
| Category | House Prices |
| Region | N/A |
| Source | Standard and Poor's |
Stats
| Last Value | 531.47 |
| Latest Period | Mar 2026 |
| Last Updated | Jun 1 2026, 09:43 EDT |
| Next Release | Jun 30 2026, 09:00 EDT |
| Average Growth Rate | 5.69% |
| Value from Last Month | 534.50 |
| Change from Last Month | -0.57% |
| Value from 1 Year Ago | 532.62 |
| Change from 1 Year Ago | -0.22% |
| Frequency | Monthly |
| Unit | Index January 2000=100 |
| Adjustment | Seasonally Adjusted |
| Download Source File |