

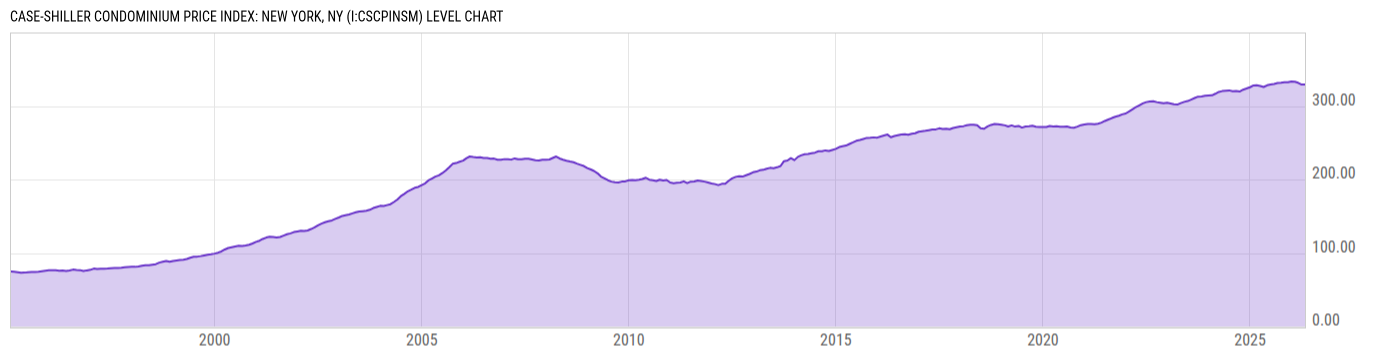
Case-Shiller Condominium Price Index: New York, NY (I:CSCPINSM)
329.38 for Apr 2026
Level Chart
Basic Info
|
Case-Shiller Condominium Price Index: New York, NY is at a current level of 329.38, up from 329.16 last month and up from 325.83 one year ago. This is a change of 0.07% from last month and 1.09% from one year ago. |
| Report | Case-Shiller Home Price Index |
| Category | House Prices |
| Region | N/A |
| Source | Standard and Poor's |
Stats
| Last Value | 329.38 |
| Latest Period | Apr 2026 |
| Last Updated | Jun 30 2026, 10:38 EDT |
| Next Release | Jul 28 2026, 09:00 EDT |
| Average Growth Rate | 4.78% |
| Value from Last Month | 329.16 |
| Change from Last Month | 0.07% |
| Value from 1 Year Ago | 325.83 |
| Change from 1 Year Ago | 1.09% |
| Frequency | Monthly |
| Unit | Index January 2000=100 |
| Adjustment | Seasonally Adjusted |
| Download Source File |
Historical Data
| Date | Value |
|---|---|
| April 30, 2026 | 329.38 |
| March 31, 2026 | 329.16 |
| February 28, 2026 | 331.55 |
| January 31, 2026 | 332.94 |
| December 31, 2025 | 333.45 |
| November 30, 2025 | 332.29 |
| October 31, 2025 | 332.16 |
| September 30, 2025 | 331.57 |
| August 31, 2025 | 331.17 |
| July 31, 2025 | 329.99 |
| June 30, 2025 | 329.19 |
| May 31, 2025 | 328.14 |
| April 30, 2025 | 325.83 |
| March 31, 2025 | 327.24 |
| February 28, 2025 | 328.15 |
| January 31, 2025 | 327.98 |
| December 31, 2024 | 325.50 |
| November 30, 2024 | 323.73 |
| October 31, 2024 | 322.14 |
| September 30, 2024 | 319.65 |
| August 31, 2024 | 320.33 |
| July 31, 2024 | 319.98 |
| June 30, 2024 | 321.24 |
| May 31, 2024 | 320.74 |
| April 30, 2024 | 320.26 |
| Date | Value |
|---|---|
| March 31, 2024 | 319.12 |
| February 29, 2024 | 316.63 |
| January 31, 2024 | 314.48 |
| December 31, 2023 | 314.25 |
| November 30, 2023 | 313.79 |
| October 31, 2023 | 313.06 |
| September 30, 2023 | 312.73 |
| August 31, 2023 | 310.90 |
| July 31, 2023 | 308.77 |
| June 30, 2023 | 306.74 |
| May 31, 2023 | 305.61 |
| April 30, 2023 | 303.95 |
| March 31, 2023 | 301.91 |
| February 28, 2023 | 302.43 |
| January 31, 2023 | 303.43 |
| December 31, 2022 | 304.27 |
| November 30, 2022 | 303.70 |
| October 31, 2022 | 304.55 |
| September 30, 2022 | 305.29 |
| August 31, 2022 | 306.54 |
| July 31, 2022 | 306.24 |
| June 30, 2022 | 305.25 |
| May 31, 2022 | 303.53 |
| April 30, 2022 | 301.00 |
| March 31, 2022 | 298.59 |
News
Headline
Time (ET)
06/30 12:33
06/12 16:45
Basic Info
|
Case-Shiller Condominium Price Index: New York, NY is at a current level of 329.38, up from 329.16 last month and up from 325.83 one year ago. This is a change of 0.07% from last month and 1.09% from one year ago. |
| Report | Case-Shiller Home Price Index |
| Category | House Prices |
| Region | N/A |
| Source | Standard and Poor's |
Stats
| Last Value | 329.38 |
| Latest Period | Apr 2026 |
| Last Updated | Jun 30 2026, 10:38 EDT |
| Next Release | Jul 28 2026, 09:00 EDT |
| Average Growth Rate | 4.78% |
| Value from Last Month | 329.16 |
| Change from Last Month | 0.07% |
| Value from 1 Year Ago | 325.83 |
| Change from 1 Year Ago | 1.09% |
| Frequency | Monthly |
| Unit | Index January 2000=100 |
| Adjustment | Seasonally Adjusted |
| Download Source File |