

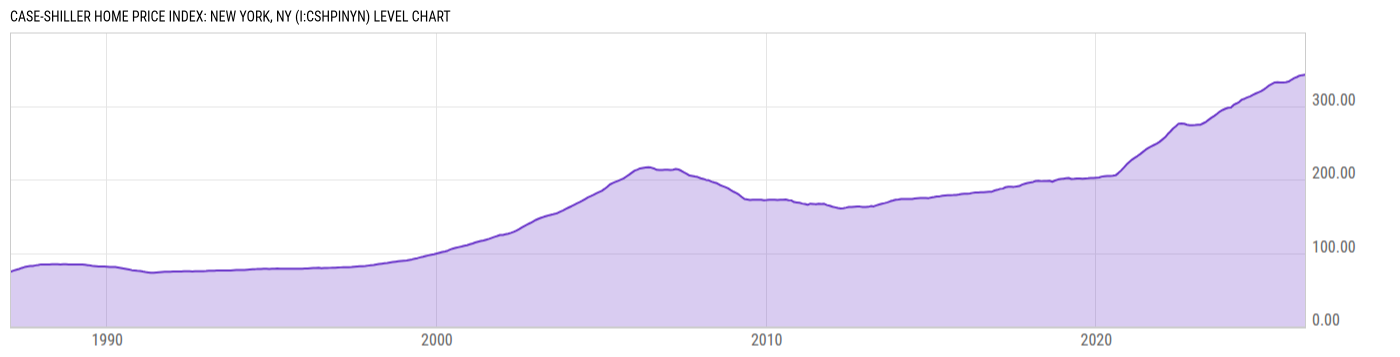
Case-Shiller Home Price Index: New York, NY (I:CSHPINYN)
342.62 for Apr 2026
Level Chart
Basic Info
|
Case-Shiller Home Price Index: New York, NY is at a current level of 342.62, up from 341.98 last month and up from 330.10 one year ago. This is a change of 0.19% from last month and 3.79% from one year ago. |
| Report | Case-Shiller Home Price Index |
| Category | House Prices |
| Region | N/A |
| Source | Standard and Poor's |
Stats
| Last Value | 342.62 |
| Latest Period | Apr 2026 |
| Last Updated | Jun 30 2026, 10:49 EDT |
| Next Release | Jul 28 2026, 09:00 EDT |
| Average Growth Rate | 3.91% |
| Value from Last Month | 341.98 |
| Change from Last Month | 0.19% |
| Value from 1 Year Ago | 330.10 |
| Change from 1 Year Ago | 3.79% |
| Frequency | Monthly |
| Unit | Index January 2000=100 |
| Adjustment | Seasonally Adjusted |
| Download Source File |
Historical Data
| Date | Value |
|---|---|
| April 30, 2026 | 342.62 |
| March 31, 2026 | 341.98 |
| February 28, 2026 | 341.19 |
| January 31, 2026 | 339.47 |
| December 31, 2025 | 337.88 |
| November 30, 2025 | 335.70 |
| October 31, 2025 | 333.26 |
| September 30, 2025 | 332.22 |
| August 31, 2025 | 332.12 |
| July 31, 2025 | 331.87 |
| June 30, 2025 | 332.22 |
| May 31, 2025 | 332.02 |
| April 30, 2025 | 330.10 |
| March 31, 2025 | 328.21 |
| February 28, 2025 | 325.13 |
| January 31, 2025 | 322.65 |
| December 31, 2024 | 320.16 |
| November 30, 2024 | 318.63 |
| October 31, 2024 | 316.99 |
| September 30, 2024 | 315.24 |
| August 31, 2024 | 313.17 |
| July 31, 2024 | 311.70 |
| June 30, 2024 | 309.94 |
| May 31, 2024 | 308.66 |
| April 30, 2024 | 305.44 |
| Date | Value |
|---|---|
| March 31, 2024 | 303.39 |
| February 29, 2024 | 301.42 |
| January 31, 2024 | 297.98 |
| December 31, 2023 | 297.56 |
| November 30, 2023 | 296.22 |
| October 31, 2023 | 294.61 |
| September 30, 2023 | 292.45 |
| August 31, 2023 | 289.45 |
| July 31, 2023 | 286.60 |
| June 30, 2023 | 284.15 |
| May 31, 2023 | 281.47 |
| April 30, 2023 | 278.53 |
| March 31, 2023 | 276.52 |
| February 28, 2023 | 274.52 |
| January 31, 2023 | 274.38 |
| December 31, 2022 | 274.04 |
| November 30, 2022 | 273.91 |
| October 31, 2022 | 273.75 |
| September 30, 2022 | 274.57 |
| August 31, 2022 | 275.76 |
| July 31, 2022 | 276.03 |
| June 30, 2022 | 276.01 |
| May 31, 2022 | 272.59 |
| April 30, 2022 | 269.40 |
| March 31, 2022 | 265.26 |
News
Headline
Time (ET)
07/01 17:04
06/30 12:33
Basic Info
|
Case-Shiller Home Price Index: New York, NY is at a current level of 342.62, up from 341.98 last month and up from 330.10 one year ago. This is a change of 0.19% from last month and 3.79% from one year ago. |
| Report | Case-Shiller Home Price Index |
| Category | House Prices |
| Region | N/A |
| Source | Standard and Poor's |
Stats
| Last Value | 342.62 |
| Latest Period | Apr 2026 |
| Last Updated | Jun 30 2026, 10:49 EDT |
| Next Release | Jul 28 2026, 09:00 EDT |
| Average Growth Rate | 3.91% |
| Value from Last Month | 341.98 |
| Change from Last Month | 0.19% |
| Value from 1 Year Ago | 330.10 |
| Change from 1 Year Ago | 3.79% |
| Frequency | Monthly |
| Unit | Index January 2000=100 |
| Adjustment | Seasonally Adjusted |
| Download Source File |