

Case-Shiller Home Price Index: National (I:CSHPIN)
Level Chart
Basic Info
|
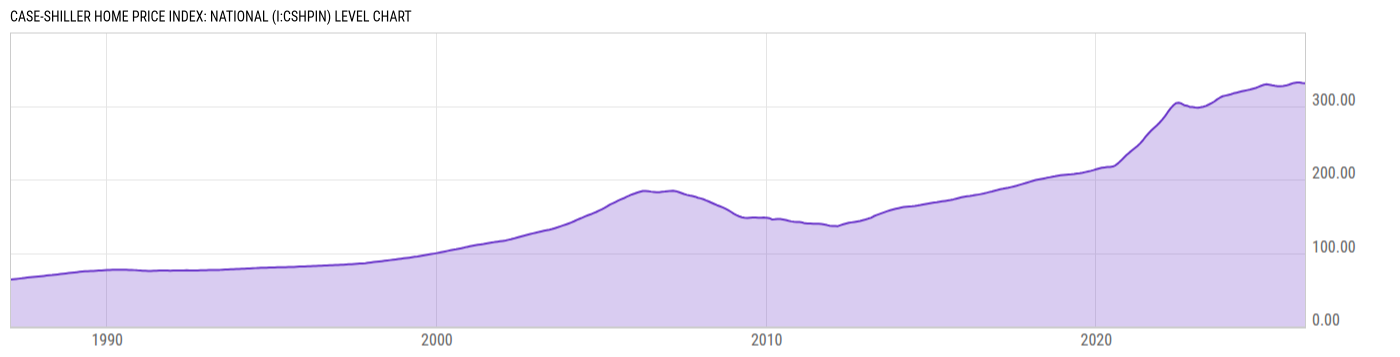
Case-Shiller Home Price Index: National is at a current level of 330.87, down from 331.36 last month and up from 328.11 one year ago. This is a change of -0.15% from last month and 0.84% from one year ago. |
|
The Case-Shiller National Home Price Index is a composite index of the single-family residential real estate values in 9 US Census divisions. The Case-Shiller method of calculating the home price index adjusts the weighting for the quality of sold homes. The Case-Shiller indices are seen as one of the most reliable measures of housing price trends in the US. After peaking in 2006, housing prices sharply declined in 2008 as a result of the housing bubble bursting. |
| Report | Case-Shiller Home Price Index |
| Category | House Prices |
| Region | United States |
| Source | Standard and Poor's |
Stats
| Last Value | 330.87 |
| Latest Period | Apr 2026 |
| Last Updated | Jun 30 2026, 10:49 EDT |
| Next Release | Jul 28 2026, 09:00 EDT |
| Average Growth Rate | 4.21% |
| Value from Last Month | 331.36 |
| Change from Last Month | -0.15% |
| Value from 1 Year Ago | 328.11 |
| Change from 1 Year Ago | 0.84% |
| Frequency | Monthly |
| Unit | Index January 2000=100 |
| Adjustment | Seasonally Adjusted |
| Download Source File |
Historical Data
| Date | Value |
|---|---|
| April 30, 2026 | 330.87 |
| March 31, 2026 | 331.36 |
| February 28, 2026 | 332.07 |
| January 31, 2026 | 332.06 |
| December 31, 2025 | 331.40 |
| November 30, 2025 | 330.20 |
| October 31, 2025 | 328.85 |
| September 30, 2025 | 327.77 |
| August 31, 2025 | 327.28 |
| July 31, 2025 | 326.91 |
| June 30, 2025 | 326.95 |
| May 31, 2025 | 327.46 |
| April 30, 2025 | 328.11 |
| March 31, 2025 | 328.97 |
| February 28, 2025 | 329.53 |
| January 31, 2025 | 328.98 |
| December 31, 2024 | 327.60 |
| November 30, 2024 | 325.95 |
| October 31, 2024 | 324.54 |
| September 30, 2024 | 323.52 |
| August 31, 2024 | 322.49 |
| July 31, 2024 | 321.62 |
| June 30, 2024 | 320.75 |
| May 31, 2024 | 319.97 |
| April 30, 2024 | 319.10 |
| Date | Value |
|---|---|
| March 31, 2024 | 318.15 |
| February 29, 2024 | 317.25 |
| January 31, 2024 | 315.94 |
| December 31, 2023 | 315.03 |
| November 30, 2023 | 314.12 |
| October 31, 2023 | 313.26 |
| September 30, 2023 | 311.24 |
| August 31, 2023 | 309.02 |
| July 31, 2023 | 306.12 |
| June 30, 2023 | 303.95 |
| May 31, 2023 | 302.04 |
| April 30, 2023 | 300.23 |
| March 31, 2023 | 299.07 |
| February 28, 2023 | 298.17 |
| January 31, 2023 | 297.77 |
| December 31, 2022 | 297.86 |
| November 30, 2022 | 298.51 |
| October 31, 2022 | 298.69 |
| September 30, 2022 | 300.43 |
| August 31, 2022 | 301.04 |
| July 31, 2022 | 303.29 |
| June 30, 2022 | 304.39 |
| May 31, 2022 | 303.62 |
| April 30, 2022 | 300.58 |
| March 31, 2022 | 296.51 |
News
Basic Info
|
Case-Shiller Home Price Index: National is at a current level of 330.87, down from 331.36 last month and up from 328.11 one year ago. This is a change of -0.15% from last month and 0.84% from one year ago. |
|
The Case-Shiller National Home Price Index is a composite index of the single-family residential real estate values in 9 US Census divisions. The Case-Shiller method of calculating the home price index adjusts the weighting for the quality of sold homes. The Case-Shiller indices are seen as one of the most reliable measures of housing price trends in the US. After peaking in 2006, housing prices sharply declined in 2008 as a result of the housing bubble bursting. |
| Report | Case-Shiller Home Price Index |
| Category | House Prices |
| Region | United States |
| Source | Standard and Poor's |
Stats
| Last Value | 330.87 |
| Latest Period | Apr 2026 |
| Last Updated | Jun 30 2026, 10:49 EDT |
| Next Release | Jul 28 2026, 09:00 EDT |
| Average Growth Rate | 4.21% |
| Value from Last Month | 331.36 |
| Change from Last Month | -0.15% |
| Value from 1 Year Ago | 328.11 |
| Change from 1 Year Ago | 0.84% |
| Frequency | Monthly |
| Unit | Index January 2000=100 |
| Adjustment | Seasonally Adjusted |
| Download Source File |