

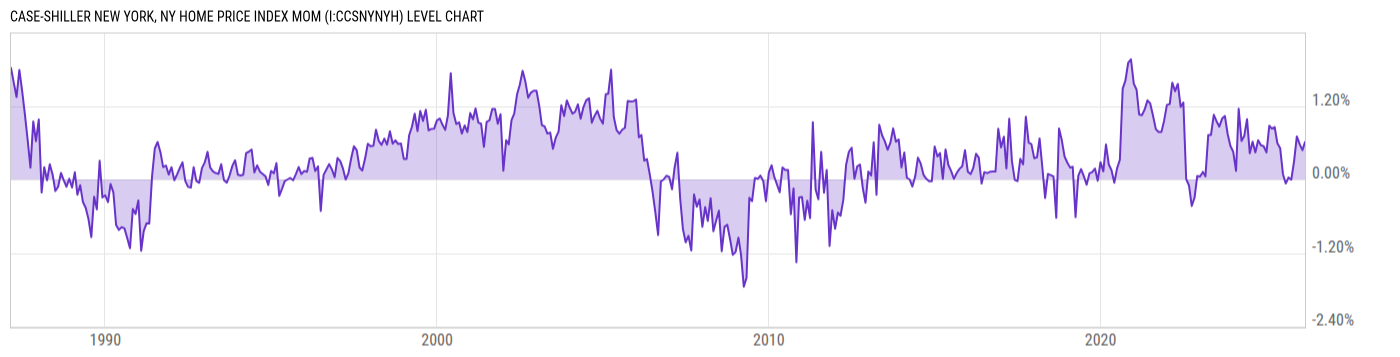
Case-Shiller New York, NY Home Price Index MoM (I:CCSNYNYH)
0.21% for Mar 2026
Level Chart
Basic Info
|
Case-Shiller New York, NY Home Price Index MoM is at 0.21%, compared to 0.51% last month and 0.96% last year. This is lower than the long term average of 0.33%. |
| Report | Case-Shiller Home Price Index |
| Category | House Prices |
| Region | N/A |
| Source | Standard and Poor's |
Stats
| Last Value | 0.21% |
| Latest Period | Mar 2026 |
| Last Updated | Jun 1 2026, 09:43 EDT |
| Next Release | Jun 30 2026, 09:00 EDT |
| Long Term Average | 0.33% |
| Average Growth Rate | -25.58% |
| Value from Last Month | 0.51% |
| Change from Last Month | -58.26% |
| Value from 1 Year Ago | 0.96% |
| Change from 1 Year Ago | -77.67% |
| Frequency | Monthly |
| Unit | Percent |
| Adjustment | Seasonally Adjusted |
| Download Source File |
Historical Data
| Date | Value |
|---|---|
| March 31, 2026 | 0.21% |
| February 28, 2026 | 0.51% |
| January 31, 2026 | 0.44% |
| December 31, 2025 | 0.60% |
| November 30, 2025 | 0.72% |
| October 31, 2025 | 0.31% |
| September 30, 2025 | 0.01% |
| August 31, 2025 | 0.05% |
| July 31, 2025 | -0.08% |
| June 30, 2025 | 0.08% |
| May 31, 2025 | 0.54% |
| April 30, 2025 | 0.54% |
| March 31, 2025 | 0.96% |
| February 28, 2025 | 0.81% |
| January 31, 2025 | 0.81% |
| December 31, 2024 | 0.46% |
| November 30, 2024 | 0.52% |
| October 31, 2024 | 0.55% |
| September 30, 2024 | 0.65% |
| August 31, 2024 | 0.46% |
| July 31, 2024 | 0.60% |
| June 30, 2024 | 0.42% |
| May 31, 2024 | 1.01% |
| April 30, 2024 | 0.68% |
| March 31, 2024 | 0.65% |
| Date | Value |
|---|---|
| February 29, 2024 | 1.15% |
| January 31, 2024 | 0.14% |
| December 31, 2023 | 0.45% |
| November 30, 2023 | 0.55% |
| October 31, 2023 | 0.74% |
| September 30, 2023 | 1.04% |
| August 31, 2023 | 0.99% |
| July 31, 2023 | 0.86% |
| June 30, 2023 | 0.95% |
| May 31, 2023 | 1.06% |
| April 30, 2023 | 0.73% |
| March 31, 2023 | 0.73% |
| February 28, 2023 | 0.05% |
| January 31, 2023 | 0.12% |
| December 31, 2022 | 0.05% |
| November 30, 2022 | 0.06% |
| October 31, 2022 | -0.30% |
| September 30, 2022 | -0.43% |
| August 31, 2022 | -0.10% |
| July 31, 2022 | 0.01% |
| June 30, 2022 | 1.25% |
| May 31, 2022 | 1.18% |
| April 30, 2022 | 1.56% |
| March 31, 2022 | 1.44% |
| February 28, 2022 | 1.58% |
News
Headline
Time (ET)
Basic Info
|
Case-Shiller New York, NY Home Price Index MoM is at 0.21%, compared to 0.51% last month and 0.96% last year. This is lower than the long term average of 0.33%. |
| Report | Case-Shiller Home Price Index |
| Category | House Prices |
| Region | N/A |
| Source | Standard and Poor's |
Stats
| Last Value | 0.21% |
| Latest Period | Mar 2026 |
| Last Updated | Jun 1 2026, 09:43 EDT |
| Next Release | Jun 30 2026, 09:00 EDT |
| Long Term Average | 0.33% |
| Average Growth Rate | -25.58% |
| Value from Last Month | 0.51% |
| Change from Last Month | -58.26% |
| Value from 1 Year Ago | 0.96% |
| Change from 1 Year Ago | -77.67% |
| Frequency | Monthly |
| Unit | Percent |
| Adjustment | Seasonally Adjusted |
| Download Source File |