

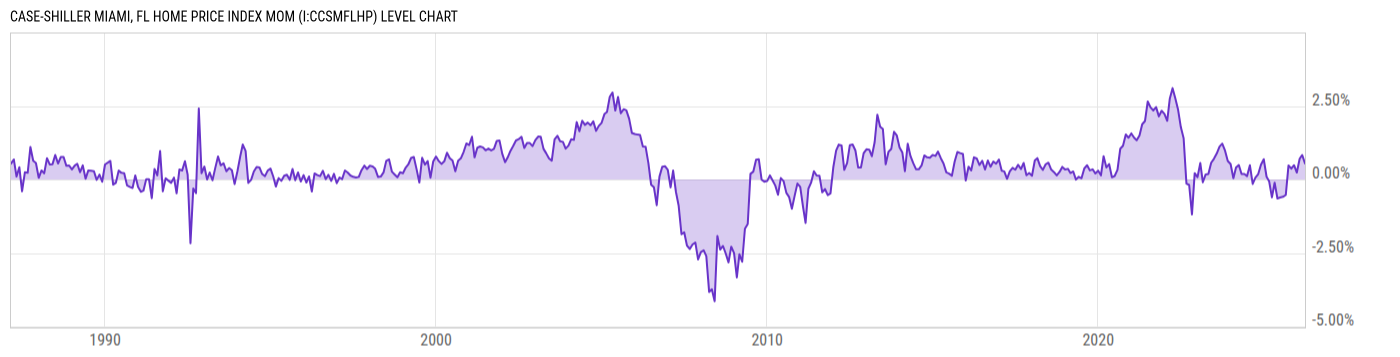
Case-Shiller Miami, FL Home Price Index MoM (I:CCSMFLHP)
0.55% for Mar 2026
Level Chart
Basic Info
|
Case-Shiller Miami, FL Home Price Index MoM is at 0.55%, compared to 0.83% last month and -0.61% last year. This is higher than the long term average of 0.41%. |
| Report | Case-Shiller Home Price Index |
| Category | House Prices |
| Region | N/A |
| Source | Standard and Poor's |
Stats
| Last Value | 0.55% |
| Latest Period | Mar 2026 |
| Last Updated | Jun 1 2026, 09:43 EDT |
| Next Release | Jun 30 2026, 09:00 EDT |
| Long Term Average | 0.41% |
| Average Growth Rate | -354.3% |
| Value from Last Month | 0.83% |
| Change from Last Month | -34.15% |
| Value from 1 Year Ago | -0.61% |
| Change from 1 Year Ago | N/A |
| Frequency | Monthly |
| Unit | Percent |
| Adjustment | Seasonally Adjusted |
| Download Source File |
Historical Data
| Date | Value |
|---|---|
| March 31, 2026 | 0.55% |
| February 28, 2026 | 0.83% |
| January 31, 2026 | 0.70% |
| December 31, 2025 | 0.24% |
| November 30, 2025 | 0.49% |
| October 31, 2025 | 0.37% |
| September 30, 2025 | 0.48% |
| August 31, 2025 | -0.53% |
| July 31, 2025 | -0.59% |
| June 30, 2025 | -0.61% |
| May 31, 2025 | -0.65% |
| April 30, 2025 | -0.11% |
| March 31, 2025 | -0.61% |
| February 28, 2025 | -0.06% |
| January 31, 2025 | 0.09% |
| December 31, 2024 | 0.69% |
| November 30, 2024 | 0.50% |
| October 31, 2024 | 0.18% |
| September 30, 2024 | 0.06% |
| August 31, 2024 | -0.15% |
| July 31, 2024 | 0.49% |
| June 30, 2024 | 0.12% |
| May 31, 2024 | 0.19% |
| April 30, 2024 | 0.19% |
| March 31, 2024 | 0.49% |
| Date | Value |
|---|---|
| February 29, 2024 | 0.40% |
| January 31, 2024 | 0.04% |
| December 31, 2023 | 0.53% |
| November 30, 2023 | 0.63% |
| October 31, 2023 | 0.98% |
| September 30, 2023 | 1.22% |
| August 31, 2023 | 1.12% |
| July 31, 2023 | 0.88% |
| June 30, 2023 | 0.70% |
| May 31, 2023 | 0.57% |
| April 30, 2023 | 0.19% |
| March 31, 2023 | 0.17% |
| February 28, 2023 | -0.09% |
| January 31, 2023 | 0.56% |
| December 31, 2022 | 0.08% |
| November 30, 2022 | 0.22% |
| October 31, 2022 | -1.19% |
| September 30, 2022 | -0.19% |
| August 31, 2022 | -0.14% |
| July 31, 2022 | 1.40% |
| June 30, 2022 | 1.78% |
| May 31, 2022 | 2.37% |
| April 30, 2022 | 2.76% |
| March 31, 2022 | 3.11% |
| February 28, 2022 | 2.75% |
News
Headline
Time (ET)
Basic Info
|
Case-Shiller Miami, FL Home Price Index MoM is at 0.55%, compared to 0.83% last month and -0.61% last year. This is higher than the long term average of 0.41%. |
| Report | Case-Shiller Home Price Index |
| Category | House Prices |
| Region | N/A |
| Source | Standard and Poor's |
Stats
| Last Value | 0.55% |
| Latest Period | Mar 2026 |
| Last Updated | Jun 1 2026, 09:43 EDT |
| Next Release | Jun 30 2026, 09:00 EDT |
| Long Term Average | 0.41% |
| Average Growth Rate | -354.3% |
| Value from Last Month | 0.83% |
| Change from Last Month | -34.15% |
| Value from 1 Year Ago | -0.61% |
| Change from 1 Year Ago | N/A |
| Frequency | Monthly |
| Unit | Percent |
| Adjustment | Seasonally Adjusted |
| Download Source File |