

Case-Shiller Home Price Index: Composite 20 (I:CSHPI)
Level Chart
Basic Info
|
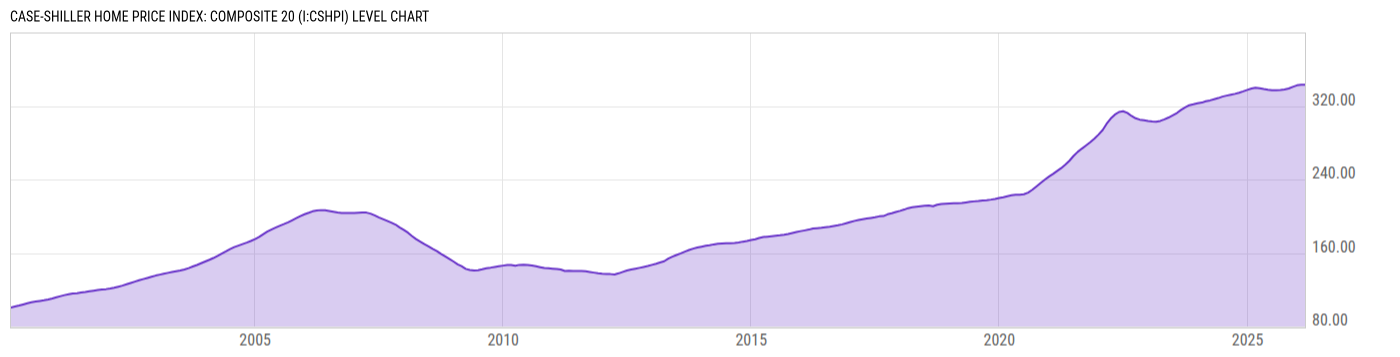
Case-Shiller Home Price Index: Composite 20 is at a current level of 343.00, down from 343.16 last month and up from 339.97 one year ago. This is a change of -0.05% from last month and 0.89% from one year ago. |
|
The Case-Shiller Composite 20 Home Price Index is a composite index of residential real estate values in 20 major US metropolitan areas. The Case-Shiller method of calculating the home price index adjusts the weighting for the quality of sold homes. The Case-Shiller indices are seen as one of the most reliable measures of housing price trends in the US. After peaking in 2006, housing prices sharply declined in 2008 as a result of the housing bubble bursting. |
| Report | Case-Shiller Home Price Index |
| Category | House Prices |
| Region | United States |
| Source | Standard and Poor's |
Stats
| Last Value | 343.00 |
| Latest Period | Feb 2026 |
| Last Updated | Apr 28 2026, 10:15 EDT |
| Next Release | May 26 2026, 09:00 EDT |
| Average Growth Rate | 4.75% |
| Value from Last Month | 343.16 |
| Change from Last Month | -0.05% |
| Value from 1 Year Ago | 339.97 |
| Change from 1 Year Ago | 0.89% |
| Frequency | Monthly |
| Unit | Index January 2000=100 |
| Adjustment | Seasonally Adjusted |
| Download Source File |
Historical Data
| Date | Value |
|---|---|
| February 28, 2026 | 343.00 |
| January 31, 2026 | 343.16 |
| December 31, 2025 | 342.47 |
| November 30, 2025 | 340.83 |
| October 31, 2025 | 339.01 |
| September 30, 2025 | 337.87 |
| August 31, 2025 | 337.44 |
| July 31, 2025 | 337.24 |
| June 30, 2025 | 337.24 |
| May 31, 2025 | 337.73 |
| April 30, 2025 | 338.49 |
| March 31, 2025 | 339.36 |
| February 28, 2025 | 339.97 |
| January 31, 2025 | 339.07 |
| December 31, 2024 | 337.54 |
| November 30, 2024 | 335.92 |
| October 31, 2024 | 334.50 |
| September 30, 2024 | 333.21 |
| August 31, 2024 | 332.25 |
| July 31, 2024 | 331.28 |
| June 30, 2024 | 330.18 |
| May 31, 2024 | 328.63 |
| April 30, 2024 | 327.31 |
| March 31, 2024 | 326.09 |
| February 29, 2024 | 325.22 |
| Date | Value |
|---|---|
| January 31, 2024 | 323.69 |
| December 31, 2023 | 323.01 |
| November 30, 2023 | 321.83 |
| October 31, 2023 | 320.85 |
| September 30, 2023 | 318.44 |
| August 31, 2023 | 315.83 |
| July 31, 2023 | 312.34 |
| June 30, 2023 | 309.73 |
| May 31, 2023 | 307.44 |
| April 30, 2023 | 305.43 |
| March 31, 2023 | 303.74 |
| February 28, 2023 | 302.86 |
| January 31, 2023 | 303.11 |
| December 31, 2022 | 303.57 |
| November 30, 2022 | 304.53 |
| October 31, 2022 | 305.15 |
| September 30, 2022 | 306.62 |
| August 31, 2022 | 309.12 |
| July 31, 2022 | 312.49 |
| June 30, 2022 | 314.29 |
| May 31, 2022 | 313.45 |
| April 30, 2022 | 310.52 |
| March 31, 2022 | 306.30 |
| February 28, 2022 | 300.44 |
| January 31, 2022 | 293.86 |
News
Basic Info
|
Case-Shiller Home Price Index: Composite 20 is at a current level of 343.00, down from 343.16 last month and up from 339.97 one year ago. This is a change of -0.05% from last month and 0.89% from one year ago. |
|
The Case-Shiller Composite 20 Home Price Index is a composite index of residential real estate values in 20 major US metropolitan areas. The Case-Shiller method of calculating the home price index adjusts the weighting for the quality of sold homes. The Case-Shiller indices are seen as one of the most reliable measures of housing price trends in the US. After peaking in 2006, housing prices sharply declined in 2008 as a result of the housing bubble bursting. |
| Report | Case-Shiller Home Price Index |
| Category | House Prices |
| Region | United States |
| Source | Standard and Poor's |
Stats
| Last Value | 343.00 |
| Latest Period | Feb 2026 |
| Last Updated | Apr 28 2026, 10:15 EDT |
| Next Release | May 26 2026, 09:00 EDT |
| Average Growth Rate | 4.75% |
| Value from Last Month | 343.16 |
| Change from Last Month | -0.05% |
| Value from 1 Year Ago | 339.97 |
| Change from 1 Year Ago | 0.89% |
| Frequency | Monthly |
| Unit | Index January 2000=100 |
| Adjustment | Seasonally Adjusted |
| Download Source File |