

Case-Shiller Home Price Index: Composite 10 (I:CSHPIC10)
Level Chart
Basic Info
|
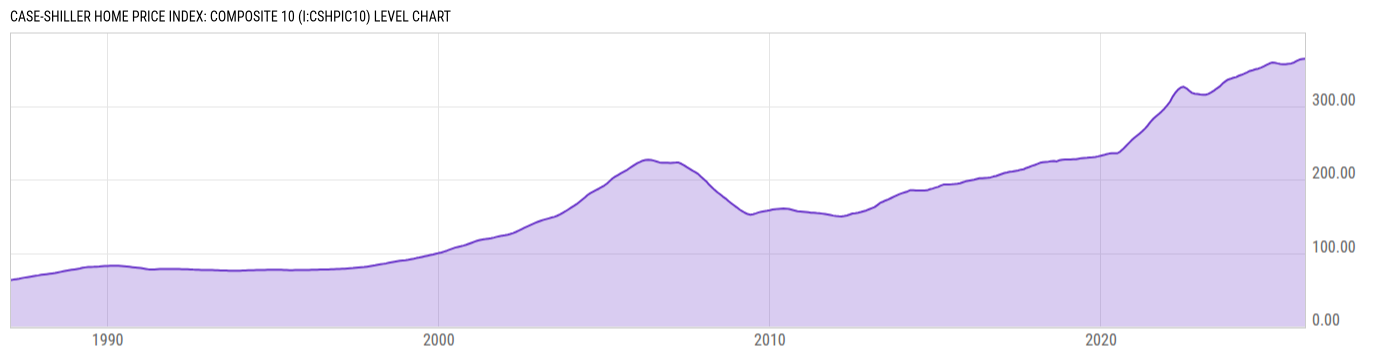
Case-Shiller Home Price Index: Composite 10 is at a current level of 364.03, down from 364.15 last month and up from 358.88 one year ago. This is a change of -0.03% from last month and 1.44% from one year ago. |
|
The Case-Shiller Composite 10 Home Price Index is a composite index of residential real estate values in 10 major US metropolitan areas. The Case-Shiller method of calculating the home price index adjusts the weighting for the quality of sold homes. The Case-Shiller indices are seen as one of the most reliable measures of housing price trends in the US. After peaking in 2006, housing prices sharply declined in 2008 as a result of the housing bubble bursting. |
| Report | Case-Shiller Home Price Index |
| Category | House Prices |
| Region | United States |
| Source | Standard and Poor's |
Stats
| Last Value | 364.03 |
| Latest Period | Mar 2026 |
| Last Updated | May 29 2026, 18:24 EDT |
| Next Release | Jun 30 2026, 09:00 EDT |
| Average Growth Rate | 4.51% |
| Value from Last Month | 364.15 |
| Change from Last Month | -0.03% |
| Value from 1 Year Ago | 358.88 |
| Change from 1 Year Ago | 1.44% |
| Frequency | Monthly |
| Unit | Index January 2000=100 |
| Adjustment | Seasonally Adjusted |
| Download Source File |
Historical Data
| Date | Value |
|---|---|
| March 31, 2026 | 364.03 |
| February 28, 2026 | 364.15 |
| January 31, 2026 | 363.97 |
| December 31, 2025 | 363.16 |
| November 30, 2025 | 361.40 |
| October 31, 2025 | 359.31 |
| September 30, 2025 | 358.05 |
| August 31, 2025 | 357.40 |
| July 31, 2025 | 356.83 |
| June 30, 2025 | 356.86 |
| May 31, 2025 | 357.25 |
| April 30, 2025 | 357.98 |
| March 31, 2025 | 358.88 |
| February 28, 2025 | 358.83 |
| January 31, 2025 | 357.61 |
| December 31, 2024 | 355.90 |
| November 30, 2024 | 354.01 |
| October 31, 2024 | 352.40 |
| September 30, 2024 | 350.84 |
| August 31, 2024 | 349.96 |
| July 31, 2024 | 348.75 |
| June 30, 2024 | 347.65 |
| May 31, 2024 | 345.73 |
| April 30, 2024 | 344.00 |
| March 31, 2024 | 342.51 |
| Date | Value |
|---|---|
| February 29, 2024 | 341.17 |
| January 31, 2024 | 339.31 |
| December 31, 2023 | 338.47 |
| November 30, 2023 | 336.99 |
| October 31, 2023 | 335.82 |
| September 30, 2023 | 333.17 |
| August 31, 2023 | 330.14 |
| July 31, 2023 | 326.28 |
| June 30, 2023 | 323.73 |
| May 31, 2023 | 320.93 |
| April 30, 2023 | 318.57 |
| March 31, 2023 | 316.52 |
| February 28, 2023 | 315.26 |
| January 31, 2023 | 315.39 |
| December 31, 2022 | 315.56 |
| November 30, 2022 | 316.26 |
| October 31, 2022 | 316.74 |
| September 30, 2022 | 317.87 |
| August 31, 2022 | 320.71 |
| July 31, 2022 | 324.05 |
| June 30, 2022 | 326.11 |
| May 31, 2022 | 325.26 |
| April 30, 2022 | 322.26 |
| March 31, 2022 | 318.02 |
| February 28, 2022 | 312.39 |
News
Basic Info
|
Case-Shiller Home Price Index: Composite 10 is at a current level of 364.03, down from 364.15 last month and up from 358.88 one year ago. This is a change of -0.03% from last month and 1.44% from one year ago. |
|
The Case-Shiller Composite 10 Home Price Index is a composite index of residential real estate values in 10 major US metropolitan areas. The Case-Shiller method of calculating the home price index adjusts the weighting for the quality of sold homes. The Case-Shiller indices are seen as one of the most reliable measures of housing price trends in the US. After peaking in 2006, housing prices sharply declined in 2008 as a result of the housing bubble bursting. |
| Report | Case-Shiller Home Price Index |
| Category | House Prices |
| Region | United States |
| Source | Standard and Poor's |
Stats
| Last Value | 364.03 |
| Latest Period | Mar 2026 |
| Last Updated | May 29 2026, 18:24 EDT |
| Next Release | Jun 30 2026, 09:00 EDT |
| Average Growth Rate | 4.51% |
| Value from Last Month | 364.15 |
| Change from Last Month | -0.03% |
| Value from 1 Year Ago | 358.88 |
| Change from 1 Year Ago | 1.44% |
| Frequency | Monthly |
| Unit | Index January 2000=100 |
| Adjustment | Seasonally Adjusted |
| Download Source File |