

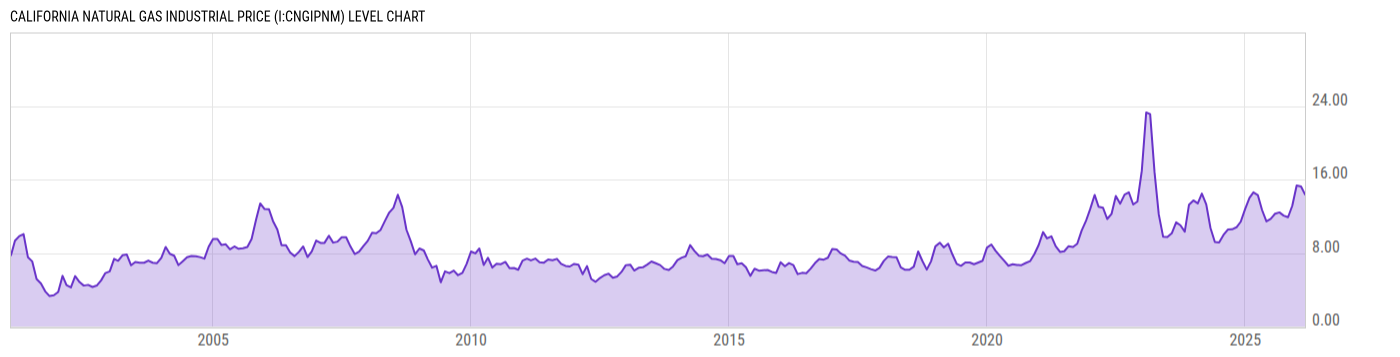
California Natural Gas Industrial Price (I:CNGIPNM)
14.38 USD/thou cf for Feb 2026
Level Chart
Basic Info
|
California Natural Gas Industrial Price is at a current level of 14.38, down from 15.23 last month and down from 14.60 one year ago. This is a change of -5.58% from last month and -1.51% from one year ago. |
| Report | Natural Gas Monthly |
| Category | Energy |
| Region | California |
| Source | Energy Information Administration |
Stats
| Last Value | 14.38 |
| Latest Period | Feb 2026 |
| Last Updated | May 3 2026, 18:14 EDT |
| Next Release | May 29 2026, 10:30 EDT |
| Average Growth Rate | 8.83% |
| Value from Last Month | 15.23 |
| Change from Last Month | -5.58% |
| Value from 1 Year Ago | 14.60 |
| Change from 1 Year Ago | -1.51% |
| Frequency | Monthly |
| Unit | USD per Thousand Cubic Feet |
| Adjustment | N/A |
| Download Source File |
Historical Data
| Date | Value |
|---|---|
| February 28, 2026 | 14.38 |
| January 31, 2026 | 15.23 |
| December 31, 2025 | 15.35 |
| November 30, 2025 | 13.14 |
| October 31, 2025 | 11.89 |
| September 30, 2025 | 12.07 |
| August 31, 2025 | 12.42 |
| July 31, 2025 | 12.27 |
| June 30, 2025 | 11.72 |
| May 31, 2025 | 11.44 |
| April 30, 2025 | 12.68 |
| March 31, 2025 | 14.31 |
| February 28, 2025 | 14.60 |
| January 31, 2025 | 14.00 |
| December 31, 2024 | 12.77 |
| November 30, 2024 | 11.40 |
| October 31, 2024 | 10.80 |
| September 30, 2024 | 10.58 |
| August 31, 2024 | 10.55 |
| July 31, 2024 | 9.96 |
| June 30, 2024 | 9.15 |
| May 31, 2024 | 9.19 |
| April 30, 2024 | 10.72 |
| March 31, 2024 | 13.30 |
| February 29, 2024 | 14.47 |
| Date | Value |
|---|---|
| January 31, 2024 | 13.40 |
| December 31, 2023 | 13.72 |
| November 30, 2023 | 13.26 |
| October 31, 2023 | 10.32 |
| September 30, 2023 | 11.02 |
| August 31, 2023 | 11.34 |
| July 31, 2023 | 10.14 |
| June 30, 2023 | 9.75 |
| May 31, 2023 | 9.76 |
| April 30, 2023 | 12.20 |
| March 31, 2023 | 16.80 |
| February 28, 2023 | 23.11 |
| January 31, 2023 | 23.29 |
| December 31, 2022 | 16.96 |
| November 30, 2022 | 13.61 |
| October 31, 2022 | 13.28 |
| September 30, 2022 | 14.61 |
| August 31, 2022 | 14.36 |
| July 31, 2022 | 13.37 |
| June 30, 2022 | 14.20 |
| May 31, 2022 | 12.27 |
| April 30, 2022 | 11.70 |
| March 31, 2022 | 12.93 |
| February 28, 2022 | 13.04 |
| January 31, 2022 | 14.32 |
News
Headline
Time (ET)
05/15 06:06
05/07 09:33
04/30 09:31
04/28 09:25
Basic Info
|
California Natural Gas Industrial Price is at a current level of 14.38, down from 15.23 last month and down from 14.60 one year ago. This is a change of -5.58% from last month and -1.51% from one year ago. |
| Report | Natural Gas Monthly |
| Category | Energy |
| Region | California |
| Source | Energy Information Administration |
Stats
| Last Value | 14.38 |
| Latest Period | Feb 2026 |
| Last Updated | May 3 2026, 18:14 EDT |
| Next Release | May 29 2026, 10:30 EDT |
| Average Growth Rate | 8.83% |
| Value from Last Month | 15.23 |
| Change from Last Month | -5.58% |
| Value from 1 Year Ago | 14.60 |
| Change from 1 Year Ago | -1.51% |
| Frequency | Monthly |
| Unit | USD per Thousand Cubic Feet |
| Adjustment | N/A |
| Download Source File |