

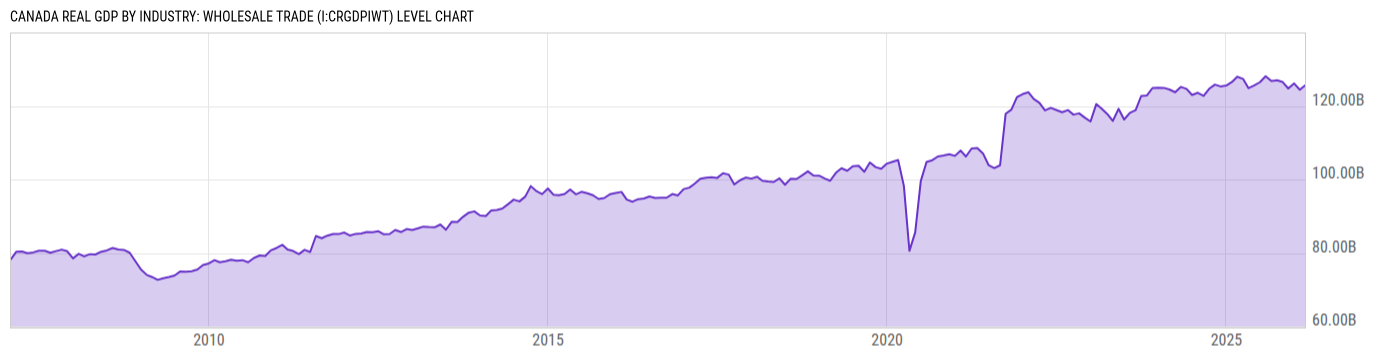
Canada Real GDP by Industry: Wholesale Trade (I:CRGDPIWT)
128.71B Chn 2012 CAD for Mar 2026
Level Chart
Basic Info
|
Canada Real GDP by Industry: Wholesale Trade is at a current level of 128.71B, up from 126.38B last month and up from 127.49B one year ago. This is a change of 1.84% from last month and 0.96% from one year ago. |
| Report | Canada GDP by Industry |
| Category | GDP |
| Region | Canada |
| Source | Statistics Canada |
Stats
| Last Value | 128.71B |
| Latest Period | Mar 2026 |
| Last Updated | May 29 2026, 08:37 EDT |
| Next Release | Jun 30 2026, 08:30 EDT |
| Average Growth Rate | 2.91% |
| Value from Last Month | 126.38B |
| Change from Last Month | 1.84% |
| Value from 1 Year Ago | 127.49B |
| Change from 1 Year Ago | 0.96% |
| Frequency | Monthly |
| Unit | Chained 2012 CAD |
| Adjustment | Seasonally Adjusted Annual Rate |
| Download Source File |
Historical Data
| Date | Value |
|---|---|
| March 31, 2026 | 128.71B |
| February 28, 2026 | 126.38B |
| January 31, 2026 | 124.61B |
| December 31, 2025 | 126.40B |
| November 30, 2025 | 124.90B |
| October 31, 2025 | 126.58B |
| September 30, 2025 | 127.06B |
| August 31, 2025 | 126.92B |
| July 31, 2025 | 128.21B |
| June 30, 2025 | 126.55B |
| May 31, 2025 | 125.66B |
| April 30, 2025 | 124.90B |
| March 31, 2025 | 127.49B |
| February 28, 2025 | 127.90B |
| January 31, 2025 | 126.53B |
| December 31, 2024 | 125.57B |
| November 30, 2024 | 125.33B |
| October 31, 2024 | 125.83B |
| September 30, 2024 | 124.69B |
| August 31, 2024 | 122.75B |
| July 31, 2024 | 123.60B |
| June 30, 2024 | 122.99B |
| May 31, 2024 | 124.65B |
| April 30, 2024 | 125.19B |
| March 31, 2024 | 123.74B |
| Date | Value |
|---|---|
| February 29, 2024 | 124.49B |
| January 31, 2024 | 124.93B |
| December 31, 2023 | 125.00B |
| November 30, 2023 | 124.90B |
| October 31, 2023 | 122.87B |
| September 30, 2023 | 122.72B |
| August 31, 2023 | 118.87B |
| July 31, 2023 | 118.15B |
| June 30, 2023 | 116.33B |
| May 31, 2023 | 119.24B |
| April 30, 2023 | 115.92B |
| March 31, 2023 | 117.83B |
| February 28, 2023 | 119.33B |
| January 31, 2023 | 120.52B |
| December 31, 2022 | 115.77B |
| November 30, 2022 | 116.84B |
| October 31, 2022 | 118.00B |
| September 30, 2022 | 117.65B |
| August 31, 2022 | 118.89B |
| July 31, 2022 | 118.30B |
| June 30, 2022 | 118.91B |
| May 31, 2022 | 119.49B |
| April 30, 2022 | 118.80B |
| March 31, 2022 | 120.86B |
| February 28, 2022 | 121.94B |
News
Headline
Time (ET)
06/01 11:52
05/29 07:56
05/25 07:21
Basic Info
|
Canada Real GDP by Industry: Wholesale Trade is at a current level of 128.71B, up from 126.38B last month and up from 127.49B one year ago. This is a change of 1.84% from last month and 0.96% from one year ago. |
| Report | Canada GDP by Industry |
| Category | GDP |
| Region | Canada |
| Source | Statistics Canada |
Stats
| Last Value | 128.71B |
| Latest Period | Mar 2026 |
| Last Updated | May 29 2026, 08:37 EDT |
| Next Release | Jun 30 2026, 08:30 EDT |
| Average Growth Rate | 2.91% |
| Value from Last Month | 126.38B |
| Change from Last Month | 1.84% |
| Value from 1 Year Ago | 127.49B |
| Change from 1 Year Ago | 0.96% |
| Frequency | Monthly |
| Unit | Chained 2012 CAD |
| Adjustment | Seasonally Adjusted Annual Rate |
| Download Source File |