

Canada Real GDP by Industry: Health Care and Social Assistance (I:CRGDPIHC)
191.70B Chn 2012 CAD for Mar 2026
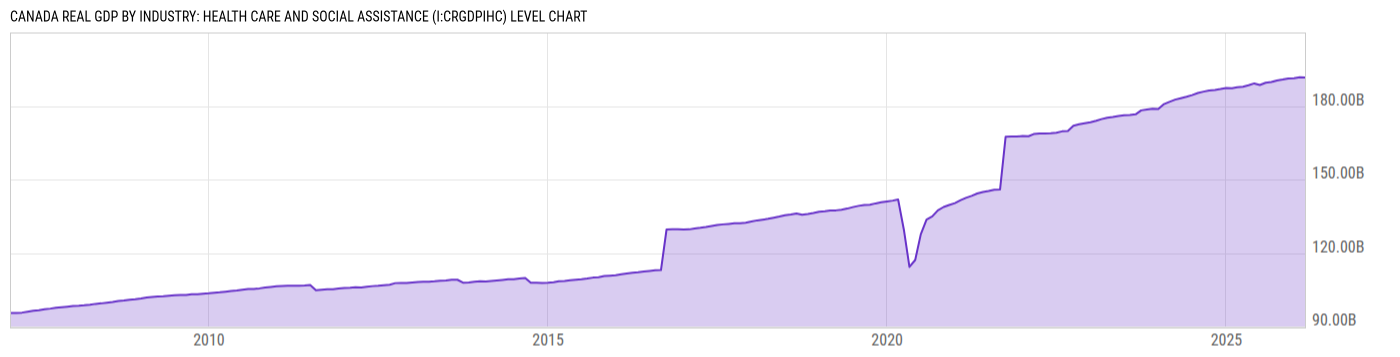
Level Chart
Basic Info
|
Canada Real GDP by Industry: Health Care and Social Assistance is at a current level of 191.70B, up from 191.69B last month and up from 187.88B one year ago. This is a change of 0.00% from last month and 2.03% from one year ago. |
| Report | Canada GDP by Industry |
| Category | GDP |
| Region | Canada |
| Source | Statistics Canada |
Stats
| Last Value | 191.70B |
| Latest Period | Mar 2026 |
| Last Updated | May 29 2026, 08:37 EDT |
| Next Release | Jun 30 2026, 08:30 EDT |
| Average Growth Rate | 3.84% |
| Value from Last Month | 191.69B |
| Change from Last Month | 0.00% |
| Value from 1 Year Ago | 187.88B |
| Change from 1 Year Ago | 2.03% |
| Frequency | Monthly |
| Unit | Chained 2012 CAD |
| Adjustment | Seasonally Adjusted Annual Rate |
| Download Source File |
Historical Data
| Date | Value |
|---|---|
| March 31, 2026 | 191.70B |
| February 28, 2026 | 191.69B |
| January 31, 2026 | 191.31B |
| December 31, 2025 | 191.14B |
| November 30, 2025 | 191.18B |
| October 31, 2025 | 190.77B |
| September 30, 2025 | 190.42B |
| August 31, 2025 | 189.81B |
| July 31, 2025 | 189.52B |
| June 30, 2025 | 188.64B |
| May 31, 2025 | 189.31B |
| April 30, 2025 | 188.55B |
| March 31, 2025 | 187.88B |
| February 28, 2025 | 187.51B |
| January 31, 2025 | 187.29B |
| December 31, 2024 | 187.38B |
| November 30, 2024 | 186.91B |
| October 31, 2024 | 186.58B |
| September 30, 2024 | 186.33B |
| August 31, 2024 | 185.87B |
| July 31, 2024 | 185.29B |
| June 30, 2024 | 184.45B |
| May 31, 2024 | 183.80B |
| April 30, 2024 | 183.19B |
| March 31, 2024 | 182.59B |
| Date | Value |
|---|---|
| February 29, 2024 | 181.70B |
| January 31, 2024 | 180.78B |
| December 31, 2023 | 178.75B |
| November 30, 2023 | 178.83B |
| October 31, 2023 | 178.56B |
| September 30, 2023 | 178.21B |
| August 31, 2023 | 176.59B |
| July 31, 2023 | 176.31B |
| June 30, 2023 | 176.20B |
| May 31, 2023 | 175.92B |
| April 30, 2023 | 175.53B |
| March 31, 2023 | 175.22B |
| February 28, 2023 | 174.64B |
| January 31, 2023 | 173.96B |
| December 31, 2022 | 173.36B |
| November 30, 2022 | 172.98B |
| October 31, 2022 | 172.57B |
| September 30, 2022 | 171.96B |
| August 31, 2022 | 169.77B |
| July 31, 2022 | 169.65B |
| June 30, 2022 | 169.09B |
| May 31, 2022 | 168.88B |
| April 30, 2022 | 168.80B |
| March 31, 2022 | 168.79B |
| February 28, 2022 | 168.53B |
News
Headline
Time (ET)
06/01 11:52
05/29 07:56
05/25 07:21
Basic Info
|
Canada Real GDP by Industry: Health Care and Social Assistance is at a current level of 191.70B, up from 191.69B last month and up from 187.88B one year ago. This is a change of 0.00% from last month and 2.03% from one year ago. |
| Report | Canada GDP by Industry |
| Category | GDP |
| Region | Canada |
| Source | Statistics Canada |
Stats
| Last Value | 191.70B |
| Latest Period | Mar 2026 |
| Last Updated | May 29 2026, 08:37 EDT |
| Next Release | Jun 30 2026, 08:30 EDT |
| Average Growth Rate | 3.84% |
| Value from Last Month | 191.69B |
| Change from Last Month | 0.00% |
| Value from 1 Year Ago | 187.88B |
| Change from 1 Year Ago | 2.03% |
| Frequency | Monthly |
| Unit | Chained 2012 CAD |
| Adjustment | Seasonally Adjusted Annual Rate |
| Download Source File |