

Canada Nondurable Goods Industries New Orders (I:CNGINO)
36.75B CAD for Mar 2026
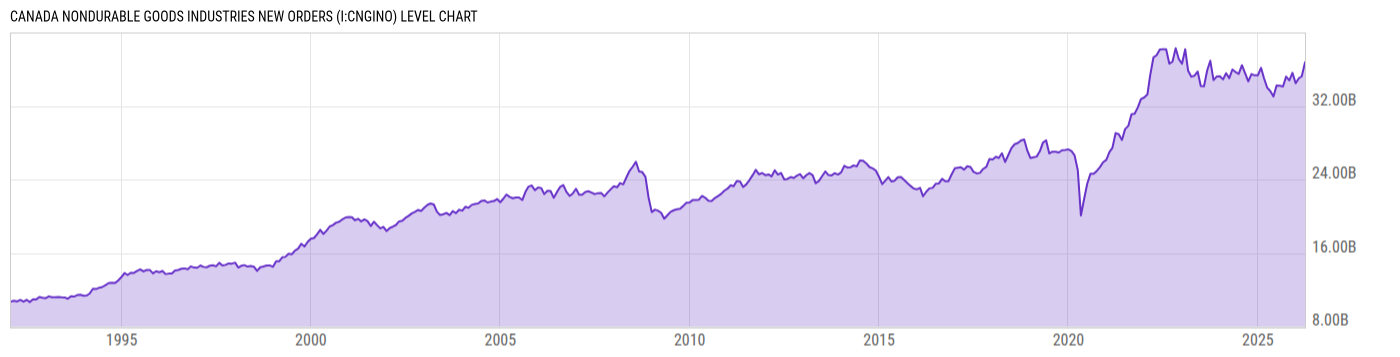
Level Chart
Basic Info
|
Canada Nondurable Goods Industries New Orders is at a current level of 36.75B, up from 35.24B last month and up from 34.01B one year ago. This is a change of 4.27% from last month and 8.05% from one year ago. |
| Region | Canada |
| Source | Statistics Canada |
Stats
| Last Value | 36.75B |
| Latest Period | Mar 2026 |
| Last Updated | May 15 2026, 08:33 EDT |
| Next Release | Jun 15 2026, 08:30 EDT |
| Average Growth Rate | 3.93% |
| Value from Last Month | 35.24B |
| Change from Last Month | 4.27% |
| Value from 1 Year Ago | 34.01B |
| Change from 1 Year Ago | 8.05% |
| Frequency | Monthly |
| Unit | CAD |
| Adjustment | Seasonally Adjusted |
| Download Source File | |
| Notes | Estimated values of new orders received during the month. |
Historical Data
| Date | Value |
|---|---|
| March 31, 2026 | 36.75B |
| February 28, 2026 | 35.24B |
| January 31, 2026 | 35.02B |
| December 31, 2025 | 34.48B |
| November 30, 2025 | 35.61B |
| October 31, 2025 | 34.79B |
| September 30, 2025 | 35.20B |
| August 31, 2025 | 34.13B |
| July 31, 2025 | 34.20B |
| June 30, 2025 | 34.23B |
| May 31, 2025 | 33.03B |
| April 30, 2025 | 33.63B |
| March 31, 2025 | 34.01B |
| February 28, 2025 | 35.05B |
| January 31, 2025 | 36.15B |
| December 31, 2024 | 35.34B |
| November 30, 2024 | 35.34B |
| October 31, 2024 | 35.47B |
| September 30, 2024 | 34.68B |
| August 31, 2024 | 35.56B |
| July 31, 2024 | 36.45B |
| June 30, 2024 | 35.50B |
| May 31, 2024 | 35.69B |
| April 30, 2024 | 35.97B |
| March 31, 2024 | 35.04B |
| Date | Value |
|---|---|
| February 29, 2024 | 35.57B |
| January 31, 2024 | 34.90B |
| December 31, 2023 | 35.24B |
| November 30, 2023 | 35.20B |
| October 31, 2023 | 34.83B |
| September 30, 2023 | 36.92B |
| August 31, 2023 | 35.89B |
| July 31, 2023 | 34.14B |
| June 30, 2023 | 34.19B |
| May 31, 2023 | 35.75B |
| April 30, 2023 | 35.30B |
| March 31, 2023 | 35.19B |
| February 28, 2023 | 35.83B |
| January 31, 2023 | 38.17B |
| December 31, 2022 | 36.60B |
| November 30, 2022 | 37.12B |
| October 31, 2022 | 38.29B |
| September 30, 2022 | 36.81B |
| August 31, 2022 | 36.60B |
| July 31, 2022 | 38.17B |
| June 30, 2022 | 38.17B |
| May 31, 2022 | 38.15B |
| April 30, 2022 | 37.52B |
| March 31, 2022 | 37.30B |
| February 28, 2022 | 35.40B |
News
Headline
Time (ET)
05/08 13:15
05/01 07:23
04/30 11:18
04/24 07:42
Basic Info
|
Canada Nondurable Goods Industries New Orders is at a current level of 36.75B, up from 35.24B last month and up from 34.01B one year ago. This is a change of 4.27% from last month and 8.05% from one year ago. |
| Region | Canada |
| Source | Statistics Canada |
Stats
| Last Value | 36.75B |
| Latest Period | Mar 2026 |
| Last Updated | May 15 2026, 08:33 EDT |
| Next Release | Jun 15 2026, 08:30 EDT |
| Average Growth Rate | 3.93% |
| Value from Last Month | 35.24B |
| Change from Last Month | 4.27% |
| Value from 1 Year Ago | 34.01B |
| Change from 1 Year Ago | 8.05% |
| Frequency | Monthly |
| Unit | CAD |
| Adjustment | Seasonally Adjusted |
| Download Source File | |
| Notes | Estimated values of new orders received during the month. |