

Canada Ivey Deliveries Index (I:CIDI)
45.00 for Apr 2026
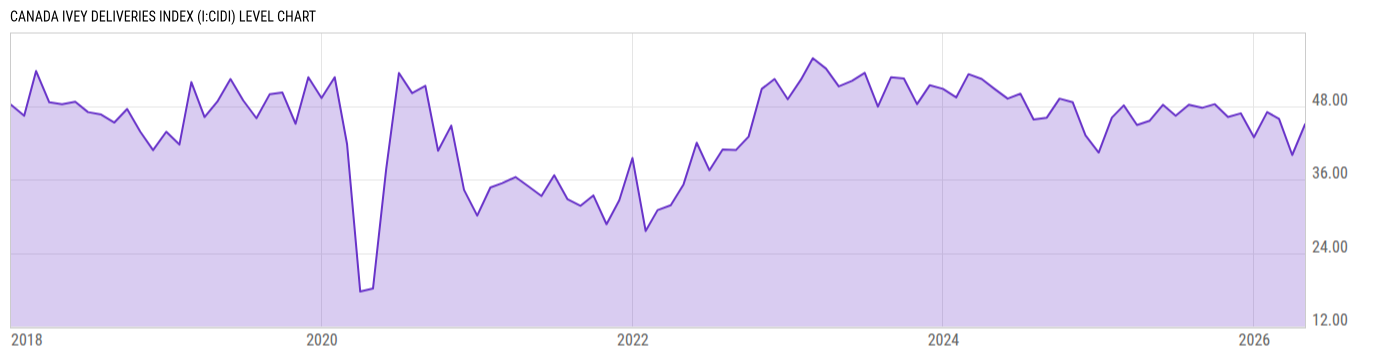
Level Chart
Basic Info
|
Canada Ivey Deliveries Index is at a current level of 45.00, up from 44.30 last month and down from 45.60 one year ago. This is a change of 1.58% from last month and -1.32% from one year ago. |
| Report | Ivey Purchasing Managers Index |
| Category | Manufacturing Statistics |
| Region | Canada |
| Source | Western University Ivey School of Business |
Stats
| Last Value | 45.00 |
| Latest Period | Apr 2026 |
| Last Updated | May 6 2026, 10:03 EDT |
| Next Release | Jun 5 2026, 10:00 EDT |
| Average Growth Rate | 12.98% |
| Value from Last Month | 44.30 |
| Change from Last Month | 1.58% |
| Value from 1 Year Ago | 45.60 |
| Change from 1 Year Ago | -1.32% |
| Frequency | Monthly |
| Adjustment | Seasonally Adjusted |
| Download Source File |
Historical Data
| Date | Value |
|---|---|
| April 30, 2026 | 45.00 |
| March 31, 2026 | 40.00 |
| February 28, 2026 | 45.90 |
| January 31, 2026 | 47.00 |
| December 31, 2025 | 42.90 |
| November 30, 2025 | 46.80 |
| October 31, 2025 | 46.20 |
| September 30, 2025 | 48.30 |
| August 31, 2025 | 47.70 |
| July 31, 2025 | 48.20 |
| June 30, 2025 | 46.40 |
| May 31, 2025 | 48.20 |
| April 30, 2025 | 45.60 |
| March 31, 2025 | 44.90 |
| February 28, 2025 | 48.10 |
| January 31, 2025 | 46.10 |
| December 31, 2024 | 40.40 |
| November 30, 2024 | 43.20 |
| October 31, 2024 | 48.60 |
| September 30, 2024 | 49.20 |
| August 31, 2024 | 46.10 |
| July 31, 2024 | 45.80 |
| June 30, 2024 | 50.00 |
| May 31, 2024 | 49.20 |
| April 30, 2024 | 50.80 |
| Date | Value |
|---|---|
| March 31, 2024 | 52.40 |
| February 29, 2024 | 53.20 |
| January 31, 2024 | 49.40 |
| December 31, 2023 | 50.80 |
| November 30, 2023 | 51.40 |
| October 31, 2023 | 48.30 |
| September 30, 2023 | 52.50 |
| August 31, 2023 | 52.70 |
| July 31, 2023 | 47.90 |
| June 30, 2023 | 53.40 |
| May 31, 2023 | 52.10 |
| April 30, 2023 | 51.20 |
| March 31, 2023 | 54.10 |
| February 28, 2023 | 55.80 |
| January 31, 2023 | 52.30 |
| December 31, 2022 | 49.10 |
| November 30, 2022 | 52.40 |
| October 31, 2022 | 50.80 |
| September 30, 2022 | 43.00 |
| August 31, 2022 | 40.80 |
| July 31, 2022 | 40.90 |
| June 30, 2022 | 37.50 |
| May 31, 2022 | 42.00 |
| April 30, 2022 | 35.20 |
| March 31, 2022 | 31.80 |
News
Headline
Time (ET)
05/22 07:41
05/01 12:49
05/01 07:23
04/23 07:31
Basic Info
|
Canada Ivey Deliveries Index is at a current level of 45.00, up from 44.30 last month and down from 45.60 one year ago. This is a change of 1.58% from last month and -1.32% from one year ago. |
| Report | Ivey Purchasing Managers Index |
| Category | Manufacturing Statistics |
| Region | Canada |
| Source | Western University Ivey School of Business |
Stats
| Last Value | 45.00 |
| Latest Period | Apr 2026 |
| Last Updated | May 6 2026, 10:03 EDT |
| Next Release | Jun 5 2026, 10:00 EDT |
| Average Growth Rate | 12.98% |
| Value from Last Month | 44.30 |
| Change from Last Month | 1.58% |
| Value from 1 Year Ago | 45.60 |
| Change from 1 Year Ago | -1.32% |
| Frequency | Monthly |
| Adjustment | Seasonally Adjusted |
| Download Source File |