

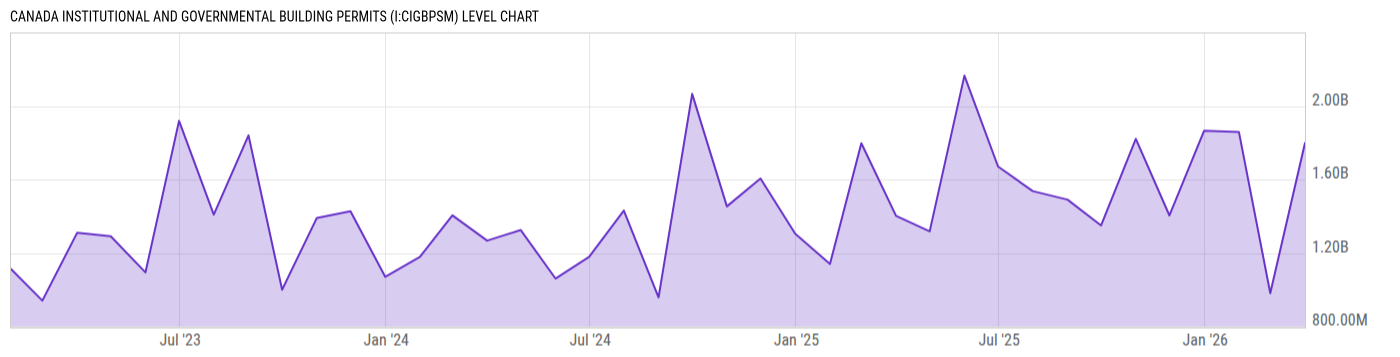
Canada Institutional and Governmental Building Permits (I:CIGBPSM)
1.799B CAD for Mar 2026
Level Chart
Basic Info
|
Canada Institutional and Governmental Building Permits is at a current level of 1.799B, up from 981.48M last month and up from 1.402B one year ago. This is a change of 83.25% from last month and 28.29% from one year ago. |
| Report | Canada Building Permits |
| Category | Construction |
| Region | Canada |
| Source | Statistics Canada |
Stats
| Last Value | 1.799B |
| Latest Period | Mar 2026 |
| Last Updated | May 19 2026, 08:33 EDT |
| Next Release | Jun 11 2026, 08:30 EDT |
| Average Growth Rate | 81.28% |
| Value from Last Month | 981.48M |
| Change from Last Month | 83.25% |
| Value from 1 Year Ago | 1.402B |
| Change from 1 Year Ago | 28.29% |
| Frequency | Monthly |
| Unit | CAD |
| Adjustment | Seasonally Adjusted |
| Download Source File |
Historical Data
| Date | Value |
|---|---|
| March 31, 2026 | 1.799B |
| February 28, 2026 | 981.48M |
| January 31, 2026 | 1.859B |
| December 31, 2025 | 1.865B |
| November 30, 2025 | 1.404B |
| October 31, 2025 | 1.821B |
| September 30, 2025 | 1.350B |
| August 31, 2025 | 1.490B |
| July 31, 2025 | 1.537B |
| June 30, 2025 | 1.671B |
| Date | Value |
|---|---|
| May 31, 2025 | 2.165B |
| April 30, 2025 | 1.318B |
| March 31, 2025 | 1.402B |
| February 28, 2025 | 1.797B |
| January 31, 2025 | 1.140B |
| December 31, 2024 | 1.305B |
| November 30, 2024 | 1.605B |
| October 31, 2024 | 1.454B |
| September 30, 2024 | 2.066B |
| August 31, 2024 | 958.20M |
News
Headline
Time (ET)
Basic Info
|
Canada Institutional and Governmental Building Permits is at a current level of 1.799B, up from 981.48M last month and up from 1.402B one year ago. This is a change of 83.25% from last month and 28.29% from one year ago. |
| Report | Canada Building Permits |
| Category | Construction |
| Region | Canada |
| Source | Statistics Canada |
Stats
| Last Value | 1.799B |
| Latest Period | Mar 2026 |
| Last Updated | May 19 2026, 08:33 EDT |
| Next Release | Jun 11 2026, 08:30 EDT |
| Average Growth Rate | 81.28% |
| Value from Last Month | 981.48M |
| Change from Last Month | 83.25% |
| Value from 1 Year Ago | 1.402B |
| Change from 1 Year Ago | 28.29% |
| Frequency | Monthly |
| Unit | CAD |
| Adjustment | Seasonally Adjusted |
| Download Source File |