

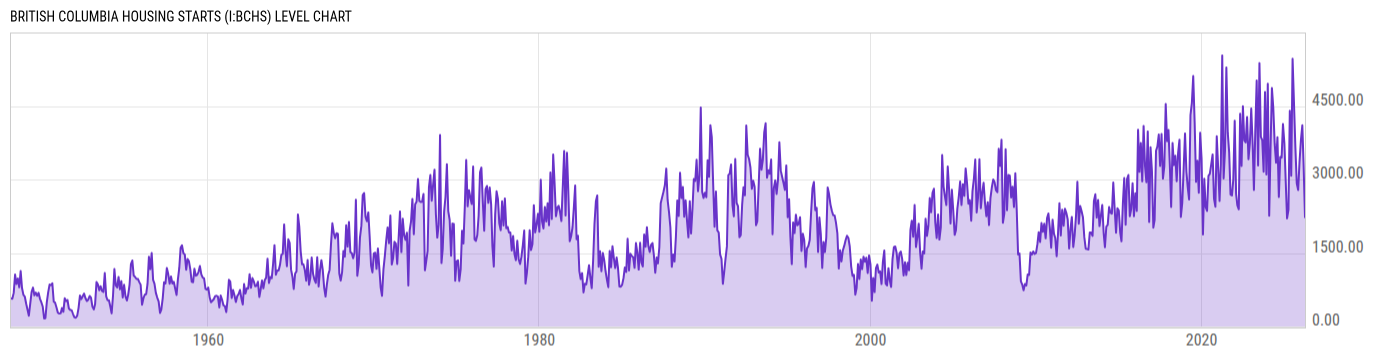
British Columbia Housing Starts (I:BCHS)
2231.00 for Mar 2026
Level Chart
Basic Info
|
British Columbia Housing Starts is at a current level of 2231.00, down from 3298.00 last month and down from 2379.00 one year ago. This is a change of -32.35% from last month and -6.22% from one year ago. |
| Report | Canada Housing Information Monthly |
| Category | Construction |
| Region | British Columbia |
| Source | Canada Mortgage and Housing Corporation |
Stats
| Last Value | 2231.00 |
| Latest Period | Mar 2026 |
| Last Updated | May 15 2026, 09:30 EDT |
| Next Release | Jun 15 2026, 08:30 EDT (E) |
| Average Growth Rate | 49.02% |
| Value from Last Month | 3298.00 |
| Change from Last Month | -32.35% |
| Value from 1 Year Ago | 2379.00 |
| Change from 1 Year Ago | -6.22% |
| Frequency | Monthly |
| Adjustment | Not Seasonally Adjusted |
| Download Source File | |
| Notes | In areas with 10,000+ population. |
Historical Data
| Date | Value |
|---|---|
| March 31, 2026 | 2231.00 |
| February 28, 2026 | 3298.00 |
| January 31, 2026 | 4105.00 |
| December 31, 2025 | 3805.00 |
| November 30, 2025 | 3357.00 |
| October 31, 2025 | 2784.00 |
| September 30, 2025 | 2922.00 |
| August 31, 2025 | 3654.00 |
| July 31, 2025 | 4553.00 |
| June 30, 2025 | 5465.00 |
| May 31, 2025 | 3078.00 |
| April 30, 2025 | 4403.00 |
| March 31, 2025 | 2379.00 |
| February 28, 2025 | 2205.00 |
| January 31, 2025 | 2927.00 |
| December 31, 2024 | 3743.00 |
| November 30, 2024 | 4132.00 |
| October 31, 2024 | 3447.00 |
| September 30, 2024 | 3461.00 |
| August 31, 2024 | 2644.00 |
| July 31, 2024 | 3860.00 |
| June 30, 2024 | 3343.00 |
| May 31, 2024 | 3731.00 |
| April 30, 2024 | 4467.00 |
| March 31, 2024 | 4867.00 |
| Date | Value |
|---|---|
| February 29, 2024 | 3616.00 |
| January 31, 2024 | 2262.00 |
| December 31, 2023 | 4954.00 |
| November 30, 2023 | 3102.00 |
| October 31, 2023 | 4788.00 |
| September 30, 2023 | 3160.00 |
| August 31, 2023 | 3805.00 |
| July 31, 2023 | 3872.00 |
| June 30, 2023 | 5375.00 |
| May 31, 2023 | 3288.00 |
| April 30, 2023 | 5020.00 |
| March 31, 2023 | 4018.00 |
| February 28, 2023 | 2787.00 |
| January 31, 2023 | 3726.00 |
| December 31, 2022 | 4450.00 |
| November 30, 2022 | 3736.00 |
| October 31, 2022 | 3413.00 |
| September 30, 2022 | 4274.00 |
| August 31, 2022 | 3758.00 |
| July 31, 2022 | 3798.00 |
| June 30, 2022 | 4493.00 |
| May 31, 2022 | 3277.00 |
| April 30, 2022 | 4341.00 |
| March 31, 2022 | 2391.00 |
| February 28, 2022 | 2469.00 |
News
Headline
Time (ET)
05/15 07:05
Home Sales Activity in Canada Seen "Low" in Key Spring Season Despite April Lift, Says National Bank
05/14 11:37
05/08 13:15
Basic Info
|
British Columbia Housing Starts is at a current level of 2231.00, down from 3298.00 last month and down from 2379.00 one year ago. This is a change of -32.35% from last month and -6.22% from one year ago. |
| Report | Canada Housing Information Monthly |
| Category | Construction |
| Region | British Columbia |
| Source | Canada Mortgage and Housing Corporation |
Stats
| Last Value | 2231.00 |
| Latest Period | Mar 2026 |
| Last Updated | May 15 2026, 09:30 EDT |
| Next Release | Jun 15 2026, 08:30 EDT (E) |
| Average Growth Rate | 49.02% |
| Value from Last Month | 3298.00 |
| Change from Last Month | -32.35% |
| Value from 1 Year Ago | 2379.00 |
| Change from 1 Year Ago | -6.22% |
| Frequency | Monthly |
| Adjustment | Not Seasonally Adjusted |
| Download Source File | |
| Notes | In areas with 10,000+ population. |