

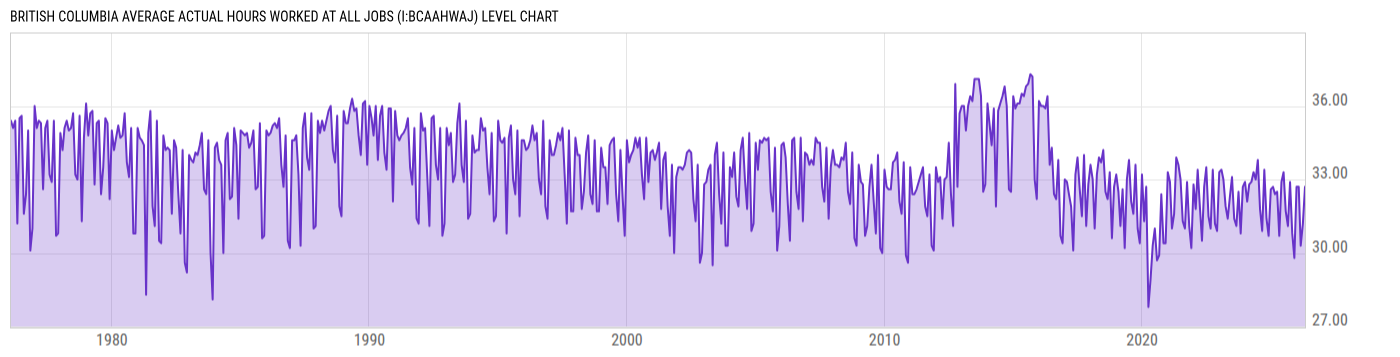
British Columbia Average Actual Hours Worked at All Jobs (I:BCAAHWAJ)
32.70 hrs for Apr 2026
Level Chart
Basic Info
|
British Columbia Average Actual Hours Worked at All Jobs is at a current level of 32.70, up from 31.20 last month and up from 30.70 one year ago. This is a change of 4.81% from last month and 6.51% from one year ago. |
| Report | Canada Labour Force Survey |
| Category | Employment |
| Region | British Columbia |
| Source | Statistics Canada |
Stats
| Last Value | 32.70 |
| Latest Period | Apr 2026 |
| Last Updated | May 8 2026, 10:23 EDT |
| Next Release | Jun 5 2026, 08:30 EDT |
| Average Growth Rate | 2.11% |
| Value from Last Month | 31.20 |
| Change from Last Month | 4.81% |
| Value from 1 Year Ago | 30.70 |
| Change from 1 Year Ago | 6.51% |
| Frequency | Monthly |
| Unit | Hours |
| Adjustment | Seasonally Adjusted |
| Download Source File |
Historical Data
| Date | Value |
|---|---|
| April 30, 2026 | 32.70 |
| March 31, 2026 | 31.20 |
| February 28, 2026 | 30.30 |
| January 31, 2026 | 32.70 |
| December 31, 2025 | 32.70 |
| November 30, 2025 | 29.80 |
| October 31, 2025 | 30.80 |
| September 30, 2025 | 32.90 |
| August 31, 2025 | 31.10 |
| July 31, 2025 | 31.70 |
| June 30, 2025 | 33.30 |
| May 31, 2025 | 32.90 |
| April 30, 2025 | 30.70 |
| March 31, 2025 | 32.50 |
| February 28, 2025 | 32.40 |
| January 31, 2025 | 32.70 |
| December 31, 2024 | 32.60 |
| November 30, 2024 | 30.70 |
| October 31, 2024 | 31.40 |
| September 30, 2024 | 33.40 |
| August 31, 2024 | 30.90 |
| July 31, 2024 | 31.80 |
| June 30, 2024 | 33.80 |
| May 31, 2024 | 33.00 |
| April 30, 2024 | 33.30 |
| Date | Value |
|---|---|
| March 31, 2024 | 32.90 |
| February 29, 2024 | 32.80 |
| January 31, 2024 | 32.10 |
| December 31, 2023 | 32.90 |
| November 30, 2023 | 32.70 |
| October 31, 2023 | 30.80 |
| September 30, 2023 | 32.50 |
| August 31, 2023 | 31.10 |
| July 31, 2023 | 31.40 |
| June 30, 2023 | 33.10 |
| May 31, 2023 | 32.30 |
| April 30, 2023 | 31.40 |
| March 31, 2023 | 31.90 |
| February 28, 2023 | 33.00 |
| January 31, 2023 | 33.40 |
| December 31, 2022 | 33.30 |
| November 30, 2022 | 30.90 |
| October 31, 2022 | 31.20 |
| September 30, 2022 | 33.40 |
| August 31, 2022 | 31.00 |
| July 31, 2022 | 31.50 |
| June 30, 2022 | 33.50 |
| May 31, 2022 | 32.70 |
| April 30, 2022 | 30.50 |
| March 31, 2022 | 31.90 |
News
Headline
Time (ET)
05/25 09:56
05/08 07:44
Basic Info
|
British Columbia Average Actual Hours Worked at All Jobs is at a current level of 32.70, up from 31.20 last month and up from 30.70 one year ago. This is a change of 4.81% from last month and 6.51% from one year ago. |
| Report | Canada Labour Force Survey |
| Category | Employment |
| Region | British Columbia |
| Source | Statistics Canada |
Stats
| Last Value | 32.70 |
| Latest Period | Apr 2026 |
| Last Updated | May 8 2026, 10:23 EDT |
| Next Release | Jun 5 2026, 08:30 EDT |
| Average Growth Rate | 2.11% |
| Value from Last Month | 31.20 |
| Change from Last Month | 4.81% |
| Value from 1 Year Ago | 30.70 |
| Change from 1 Year Ago | 6.51% |
| Frequency | Monthly |
| Unit | Hours |
| Adjustment | Seasonally Adjusted |
| Download Source File |