

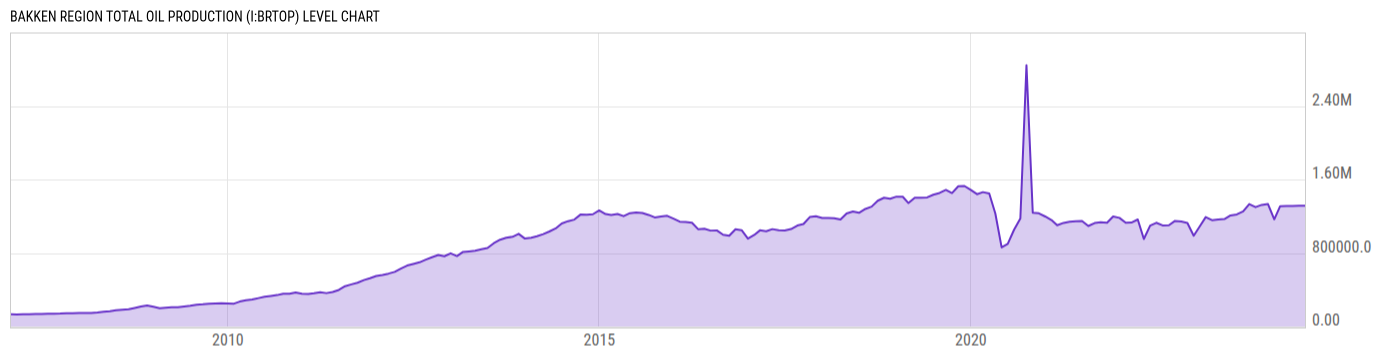
Bakken Region Total Oil Production (I:BRTOP)
1.313M bbl/d for Jun 2024
Level Chart
Basic Info
|
Bakken Region Total Oil Production is at a current level of 1.313M, up from 1.313M last month and up from 1.208M one year ago. This is a change of 0.00% from last month and 8.68% from one year ago. |
| Report | Drilling Productivity Report |
| Category | Energy |
| Region | N/A |
| Source | Energy Information Administration |
Stats
| Last Value | 1.313M |
| Latest Period | Jun 2024 |
| Last Updated | May 13 2024, 15:32 EDT |
| Next Release | Aug 11 2026, 15:30 EDT |
| Average Growth Rate | 19.29% |
| Value from Last Month | 1.313M |
| Change from Last Month | 0.00% |
| Value from 1 Year Ago | 1.208M |
| Change from 1 Year Ago | 8.68% |
| Frequency | Monthly |
| Unit | Barrels per Day |
| Adjustment | N/A |
| Download Source File |
Historical Data
| Date | Value |
|---|---|
| June 30, 2024 | 1.313M |
| May 31, 2024 | 1.313M |
| April 30, 2024 | 1.313M |
| March 31, 2024 | 1.312M |
| February 29, 2024 | 1.310M |
| January 31, 2024 | 1.167M |
| December 31, 2023 | 1.333M |
| November 30, 2023 | 1.323M |
| October 31, 2023 | 1.299M |
| September 30, 2023 | 1.333M |
| August 31, 2023 | 1.254M |
| July 31, 2023 | 1.220M |
| June 30, 2023 | 1.208M |
| May 31, 2023 | 1.169M |
| April 30, 2023 | 1.165M |
| March 31, 2023 | 1.158M |
| February 28, 2023 | 1.191M |
| January 31, 2023 | 1.094M |
| December 31, 2022 | 988065.5 |
| November 30, 2022 | 1.126M |
| October 31, 2022 | 1.143M |
| September 30, 2022 | 1.149M |
| August 31, 2022 | 1.103M |
| July 31, 2022 | 1.100M |
| June 30, 2022 | 1.129M |
| Date | Value |
|---|---|
| May 31, 2022 | 1.098M |
| April 30, 2022 | 952106.3 |
| March 31, 2022 | 1.165M |
| February 28, 2022 | 1.131M |
| January 31, 2022 | 1.129M |
| December 31, 2021 | 1.182M |
| November 30, 2021 | 1.197M |
| October 31, 2021 | 1.129M |
| September 30, 2021 | 1.134M |
| August 31, 2021 | 1.126M |
| July 31, 2021 | 1.094M |
| June 30, 2021 | 1.149M |
| May 31, 2021 | 1.146M |
| April 30, 2021 | 1.140M |
| March 31, 2021 | 1.128M |
| February 28, 2021 | 1.102M |
| January 31, 2021 | 1.159M |
| December 31, 2020 | 1.197M |
| November 30, 2020 | 1.232M |
| October 31, 2020 | 1.238M |
| September 30, 2020 | 2.843M |
| August 31, 2020 | 1.175M |
| July 31, 2020 | 1.053M |
| June 30, 2020 | 900304.4 |
| May 31, 2020 | 860855.8 |
News
Headline
Time (ET)
06/17 15:49
06/16 06:14
Basic Info
|
Bakken Region Total Oil Production is at a current level of 1.313M, up from 1.313M last month and up from 1.208M one year ago. This is a change of 0.00% from last month and 8.68% from one year ago. |
| Report | Drilling Productivity Report |
| Category | Energy |
| Region | N/A |
| Source | Energy Information Administration |
Stats
| Last Value | 1.313M |
| Latest Period | Jun 2024 |
| Last Updated | May 13 2024, 15:32 EDT |
| Next Release | Aug 11 2026, 15:30 EDT |
| Average Growth Rate | 19.29% |
| Value from Last Month | 1.313M |
| Change from Last Month | 0.00% |
| Value from 1 Year Ago | 1.208M |
| Change from 1 Year Ago | 8.68% |
| Frequency | Monthly |
| Unit | Barrels per Day |
| Adjustment | N/A |
| Download Source File |