

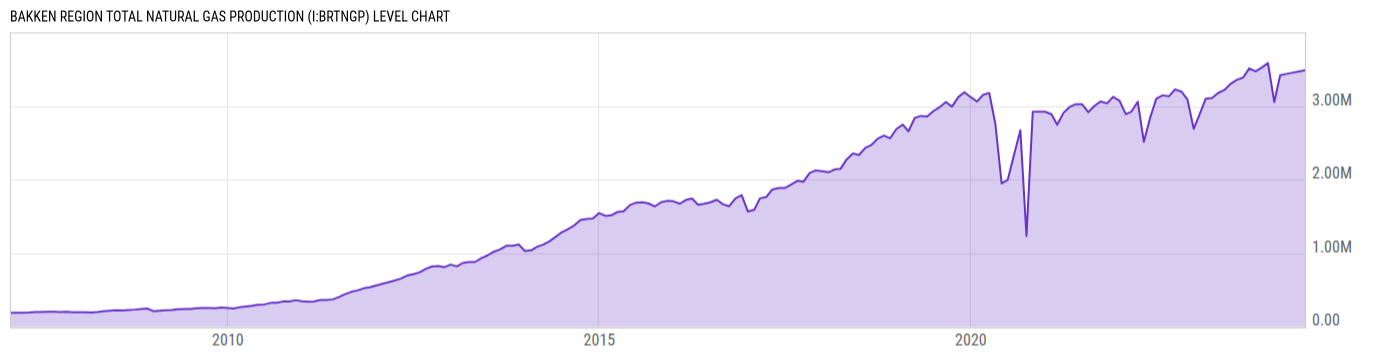
Bakken Region Total Natural Gas Production (I:BRTNGP)
3.487M cf/d for Jun 2024
Level Chart
Basic Info
|
Bakken Region Total Natural Gas Production is at a current level of 3.487M, up from 3.471M last month and up from 3.301M one year ago. This is a change of 0.47% from last month and 5.62% from one year ago. |
| Report | Drilling Productivity Report |
| Category | Energy |
| Region | N/A |
| Source | Energy Information Administration |
Stats
| Last Value | 3.487M |
| Latest Period | Jun 2024 |
| Last Updated | May 13 2024, 15:32 EDT |
| Next Release | Jun 9 2026, 15:30 EDT |
| Average Growth Rate | 22.66% |
| Value from Last Month | 3.471M |
| Change from Last Month | 0.47% |
| Value from 1 Year Ago | 3.301M |
| Change from 1 Year Ago | 5.62% |
| Frequency | Monthly |
| Unit | Cubic Feet per Day |
| Adjustment | N/A |
| Download Source File |
Historical Data
| Date | Value |
|---|---|
| June 30, 2024 | 3.487M |
| May 31, 2024 | 3.471M |
| April 30, 2024 | 3.454M |
| March 31, 2024 | 3.437M |
| February 29, 2024 | 3.419M |
| January 31, 2024 | 3.054M |
| December 31, 2023 | 3.584M |
| November 30, 2023 | 3.522M |
| October 31, 2023 | 3.471M |
| September 30, 2023 | 3.512M |
| August 31, 2023 | 3.388M |
| July 31, 2023 | 3.356M |
| June 30, 2023 | 3.301M |
| May 31, 2023 | 3.219M |
| April 30, 2023 | 3.177M |
| March 31, 2023 | 3.108M |
| February 28, 2023 | 3.100M |
| January 31, 2023 | 2.899M |
| December 31, 2022 | 2.689M |
| November 30, 2022 | 3.090M |
| October 31, 2022 | 3.197M |
| September 30, 2022 | 3.224M |
| August 31, 2022 | 3.132M |
| July 31, 2022 | 3.145M |
| June 30, 2022 | 3.099M |
| Date | Value |
|---|---|
| May 31, 2022 | 2.840M |
| April 30, 2022 | 2.514M |
| March 31, 2022 | 3.059M |
| February 28, 2022 | 2.924M |
| January 31, 2022 | 2.890M |
| December 31, 2021 | 3.072M |
| November 30, 2021 | 3.124M |
| October 31, 2021 | 3.036M |
| September 30, 2021 | 3.062M |
| August 31, 2021 | 3.003M |
| July 31, 2021 | 2.916M |
| June 30, 2021 | 3.025M |
| May 31, 2021 | 3.025M |
| April 30, 2021 | 2.987M |
| March 31, 2021 | 2.907M |
| February 28, 2021 | 2.744M |
| January 31, 2021 | 2.888M |
| December 31, 2020 | 2.922M |
| November 30, 2020 | 2.922M |
| October 31, 2020 | 2.921M |
| September 30, 2020 | 1.231M |
| August 31, 2020 | 2.671M |
| July 31, 2020 | 2.337M |
| June 30, 2020 | 1.996M |
| May 31, 2020 | 1.946M |
News
Headline
Time (ET)
Basic Info
|
Bakken Region Total Natural Gas Production is at a current level of 3.487M, up from 3.471M last month and up from 3.301M one year ago. This is a change of 0.47% from last month and 5.62% from one year ago. |
| Report | Drilling Productivity Report |
| Category | Energy |
| Region | N/A |
| Source | Energy Information Administration |
Stats
| Last Value | 3.487M |
| Latest Period | Jun 2024 |
| Last Updated | May 13 2024, 15:32 EDT |
| Next Release | Jun 9 2026, 15:30 EDT |
| Average Growth Rate | 22.66% |
| Value from Last Month | 3.471M |
| Change from Last Month | 0.47% |
| Value from 1 Year Ago | 3.301M |
| Change from 1 Year Ago | 5.62% |
| Frequency | Monthly |
| Unit | Cubic Feet per Day |
| Adjustment | N/A |
| Download Source File |