

Austin-Round Rock-San Marcos, TX House Price All-Transactions Index (I:ARRGTXHP)
502.80 for Q1 2026
Level Chart
Basic Info
|
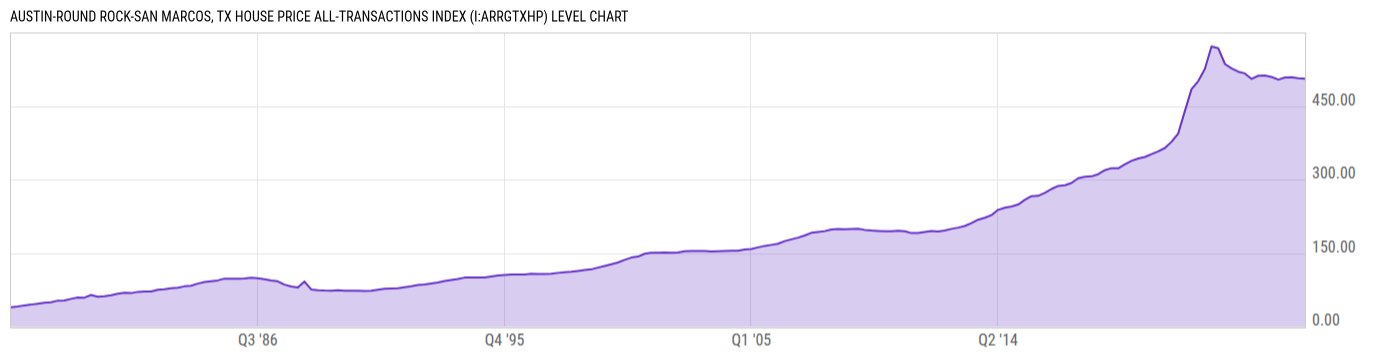
Austin-Round Rock-San Marcos, TX House Price All-Transactions Index is at a current level of 502.80, down from 504.20 last quarter and down from 506.87 one year ago. This is a change of -0.28% from last quarter and -0.80% from one year ago. |
| Report | FHFA House Price Index |
| Category | House Prices |
| Region | N/A |
| Source | Federal Housing Finance Agency |
Stats
| Last Value | 502.80 |
| Latest Period | Mar 2026 |
| Last Updated | May 26 2026, 09:12 EDT |
| Next Release | Aug 25 2026, 09:00 EDT |
| Average Growth Rate | 5.44% |
| Value from Last Quarter | 504.20 |
| Change from Last Quarter | -0.28% |
| Value from 1 Year Ago | 506.87 |
| Change from 1 Year Ago | -0.80% |
| Frequency | Quarterly |
| Unit | Index Q1 1991=100 |
| Adjustment | Not Seasonally Adjusted |
| Download Source File |
Historical Data
| Date | Value |
|---|---|
| March 31, 2026 | 502.80 |
| December 31, 2025 | 504.20 |
| September 30, 2025 | 505.03 |
| June 30, 2025 | 506.41 |
| March 31, 2025 | 506.87 |
| December 31, 2024 | 500.78 |
| September 30, 2024 | 507.69 |
| June 30, 2024 | 508.99 |
| March 31, 2024 | 511.56 |
| December 31, 2023 | 502.64 |
| September 30, 2023 | 516.30 |
| June 30, 2023 | 519.45 |
| March 31, 2023 | 526.64 |
| December 31, 2022 | 535.32 |
| September 30, 2022 | 567.95 |
| June 30, 2022 | 571.37 |
| March 31, 2022 | 524.81 |
| December 31, 2021 | 500.71 |
| September 30, 2021 | 484.32 |
| June 30, 2021 | 439.38 |
| March 31, 2021 | 393.69 |
| December 31, 2020 | 377.20 |
| September 30, 2020 | 364.28 |
| June 30, 2020 | 357.28 |
| March 31, 2020 | 351.75 |
| Date | Value |
|---|---|
| December 31, 2019 | 345.92 |
| September 30, 2019 | 342.85 |
| June 30, 2019 | 338.07 |
| March 31, 2019 | 330.91 |
| December 31, 2018 | 322.91 |
| September 30, 2018 | 323.20 |
| June 30, 2018 | 319.01 |
| March 31, 2018 | 310.76 |
| December 31, 2017 | 306.47 |
| September 30, 2017 | 305.48 |
| June 30, 2017 | 302.43 |
| March 31, 2017 | 292.79 |
| December 31, 2016 | 288.33 |
| September 30, 2016 | 286.86 |
| June 30, 2016 | 280.62 |
| March 31, 2016 | 272.70 |
| December 31, 2015 | 266.59 |
| September 30, 2015 | 266.03 |
| June 30, 2015 | 258.47 |
| March 31, 2015 | 248.81 |
| December 31, 2014 | 244.88 |
| September 30, 2014 | 242.43 |
| June 30, 2014 | 238.07 |
| March 31, 2014 | 227.16 |
| December 31, 2013 | 221.88 |
News
Headline
Time (ET)
05/15 07:05
05/14 12:00
05/14 07:24
05/08 12:34
05/07 12:00
Basic Info
|
Austin-Round Rock-San Marcos, TX House Price All-Transactions Index is at a current level of 502.80, down from 504.20 last quarter and down from 506.87 one year ago. This is a change of -0.28% from last quarter and -0.80% from one year ago. |
| Report | FHFA House Price Index |
| Category | House Prices |
| Region | N/A |
| Source | Federal Housing Finance Agency |
Stats
| Last Value | 502.80 |
| Latest Period | Mar 2026 |
| Last Updated | May 26 2026, 09:12 EDT |
| Next Release | Aug 25 2026, 09:00 EDT |
| Average Growth Rate | 5.44% |
| Value from Last Quarter | 504.20 |
| Change from Last Quarter | -0.28% |
| Value from 1 Year Ago | 506.87 |
| Change from 1 Year Ago | -0.80% |
| Frequency | Quarterly |
| Unit | Index Q1 1991=100 |
| Adjustment | Not Seasonally Adjusted |
| Download Source File |