

Apple Inc (AAPL) - Wearables, Home and Accessories Revenue (DISCONTINUED) (I:AIAAX1LA)
Level Chart
Basic Info
|
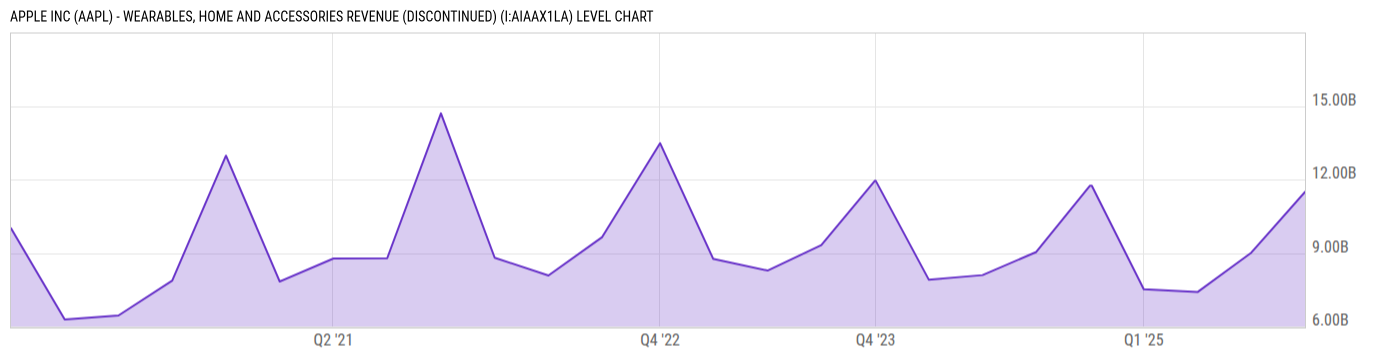
Apple Inc (AAPL) - Wearables, Home and Accessories Revenue is at a current level of 11.49B, up from 9.013B last quarter and up from 9.042B one year ago. This is a change of 27.52% from last quarter and 27.11% from one year ago. |
|
The Wearables, Home and Accessories Revenue data set offers an analysis of the revenue generated by Apple Inc's wearables, home, and accessories segment. This data set focuses on tracking and evaluating the financial performance of Apple's wearable devices (such as Apple Watch), home products (such as HomePod), and various accessories (such as AirPods and Apple-branded accessories). By examining the wearables, home, and accessories revenue data, investors, analysts, and industry professionals can gain insights into Apple's performance in the growing wearables market, assess its market share and competitiveness in the smart devices industry, and evaluate its potential for revenue growth and innovation in the wearables and accessories space. |
| Report | Fiscal.ai |
| Category | Segments & KPIs |
| Region | United States |
| Source | Fiscal.ai |
|
Data provided via Fiscal.ai |
Stats
| Last Value | 11.49B |
| Latest Period | Dec 2025 |
| Last Updated | Jan 30 2026, 08:32 EST |
| Average Growth Rate | 18.52% |
| Value from Last Quarter | 9.013B |
| Change from Last Quarter | 27.52% |
| Value from 1 Year Ago | 9.042B |
| Change from 1 Year Ago | 27.11% |
| Frequency | Quarterly |
| Unit | USD |
| Adjustment | N/A |
| Download Source File |
Historical Data
| Date | Value |
|---|---|
| December 27, 2025 | 11.49B |
| September 27, 2025 | 9.013B |
| June 28, 2025 | 7.404B |
| March 29, 2025 | 7.522B |
| December 31, 2024 | 11.75B |
| December 28, 2024 | 11.75B |
| September 28, 2024 | 9.042B |
| June 29, 2024 | 8.097B |
| March 30, 2024 | 7.913B |
| December 31, 2023 | 11.95B |
| December 30, 2023 | 11.95B |
| September 30, 2023 | 9.322B |
| July 01, 2023 | 8.284B |
| April 01, 2023 | 8.757B |
| Date | Value |
|---|---|
| March 31, 2023 | 8.757B |
| December 31, 2022 | 13.48B |
| September 24, 2022 | 9.65B |
| June 25, 2022 | 8.084B |
| March 26, 2022 | 8.806B |
| December 25, 2021 | 14.70B |
| September 25, 2021 | 8.785B |
| June 26, 2021 | 8.775B |
| March 27, 2021 | 7.836B |
| December 26, 2020 | 12.97B |
| September 26, 2020 | 7.876B |
| June 27, 2020 | 6.45B |
| March 28, 2020 | 6.284B |
| December 28, 2019 | 10.01B |
News
Basic Info
|
Apple Inc (AAPL) - Wearables, Home and Accessories Revenue is at a current level of 11.49B, up from 9.013B last quarter and up from 9.042B one year ago. This is a change of 27.52% from last quarter and 27.11% from one year ago. |
|
The Wearables, Home and Accessories Revenue data set offers an analysis of the revenue generated by Apple Inc's wearables, home, and accessories segment. This data set focuses on tracking and evaluating the financial performance of Apple's wearable devices (such as Apple Watch), home products (such as HomePod), and various accessories (such as AirPods and Apple-branded accessories). By examining the wearables, home, and accessories revenue data, investors, analysts, and industry professionals can gain insights into Apple's performance in the growing wearables market, assess its market share and competitiveness in the smart devices industry, and evaluate its potential for revenue growth and innovation in the wearables and accessories space. |
| Report | Fiscal.ai |
| Category | Segments & KPIs |
| Region | United States |
| Source | Fiscal.ai |
|
Data provided via Fiscal.ai |
Stats
| Last Value | 11.49B |
| Latest Period | Dec 2025 |
| Last Updated | Jan 30 2026, 08:32 EST |
| Average Growth Rate | 18.52% |
| Value from Last Quarter | 9.013B |
| Change from Last Quarter | 27.52% |
| Value from 1 Year Ago | 9.042B |
| Change from 1 Year Ago | 27.11% |
| Frequency | Quarterly |
| Unit | USD |
| Adjustment | N/A |
| Download Source File |