

Apple Inc (AAPL) - Products Revenue (DISCONTINUED) (I:AIAAPP8N)
Level Chart
Basic Info
|
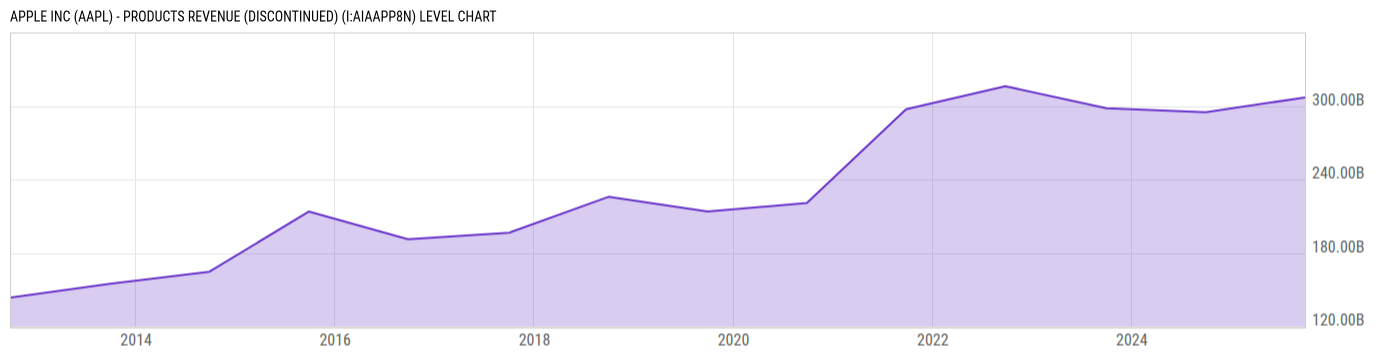
Apple Inc (AAPL) - Products Revenue is at a current level of 307.00B, up from 298.08B one year ago. This is a change of 2.99% from one year ago. |
|
The Products Revenue data set provides an analysis of the total revenue generated by Apple Inc's product lines, excluding services. This data set focuses on tracking and evaluating the financial performance of Apple's hardware offerings, including iPhone, Mac, iPad, wearables, home and accessories, and other product categories. By examining the products revenue data, investors, analysts, and industry professionals can gain insights into the overall performance of Apple's hardware business, assess its market share and competitiveness in multiple technology sectors, and evaluate its potential for revenue growth and innovation across its product portfolio. |
| Report | Fiscal.ai |
| Category | Segments & KPIs |
| Region | United States |
| Source | Fiscal.ai |
|
Data provided via Fiscal.ai |
Stats
| Last Value | 307.00B |
| Latest Period | 2025 |
| Last Updated | Jan 31 2026, 08:30 EST |
| Average Growth Rate | 6.72% |
| Value from 1 Year Ago | 298.08B |
| Change from 1 Year Ago | 2.99% |
| Frequency | Yearly |
| Unit | USD |
| Adjustment | N/A |
| Download Source File |
Historical Data
| Date | Value |
|---|---|
| September 27, 2025 | 307.00B |
| September 28, 2024 | 294.87B |
| September 30, 2023 | 298.08B |
| September 24, 2022 | 316.20B |
| September 25, 2021 | 297.39B |
| September 26, 2020 | 220.75B |
| September 28, 2019 | 213.88B |
| Date | Value |
|---|---|
| September 29, 2018 | 225.85B |
| September 30, 2017 | 196.53B |
| September 24, 2016 | 191.29B |
| September 26, 2015 | 213.81B |
| September 27, 2014 | 164.73B |
| September 28, 2013 | 154.86B |
| September 29, 2012 | 143.62B |
News
Basic Info
|
Apple Inc (AAPL) - Products Revenue is at a current level of 307.00B, up from 298.08B one year ago. This is a change of 2.99% from one year ago. |
|
The Products Revenue data set provides an analysis of the total revenue generated by Apple Inc's product lines, excluding services. This data set focuses on tracking and evaluating the financial performance of Apple's hardware offerings, including iPhone, Mac, iPad, wearables, home and accessories, and other product categories. By examining the products revenue data, investors, analysts, and industry professionals can gain insights into the overall performance of Apple's hardware business, assess its market share and competitiveness in multiple technology sectors, and evaluate its potential for revenue growth and innovation across its product portfolio. |
| Report | Fiscal.ai |
| Category | Segments & KPIs |
| Region | United States |
| Source | Fiscal.ai |
|
Data provided via Fiscal.ai |
Stats
| Last Value | 307.00B |
| Latest Period | 2025 |
| Last Updated | Jan 31 2026, 08:30 EST |
| Average Growth Rate | 6.72% |
| Value from 1 Year Ago | 298.08B |
| Change from 1 Year Ago | 2.99% |
| Frequency | Yearly |
| Unit | USD |
| Adjustment | N/A |
| Download Source File |