

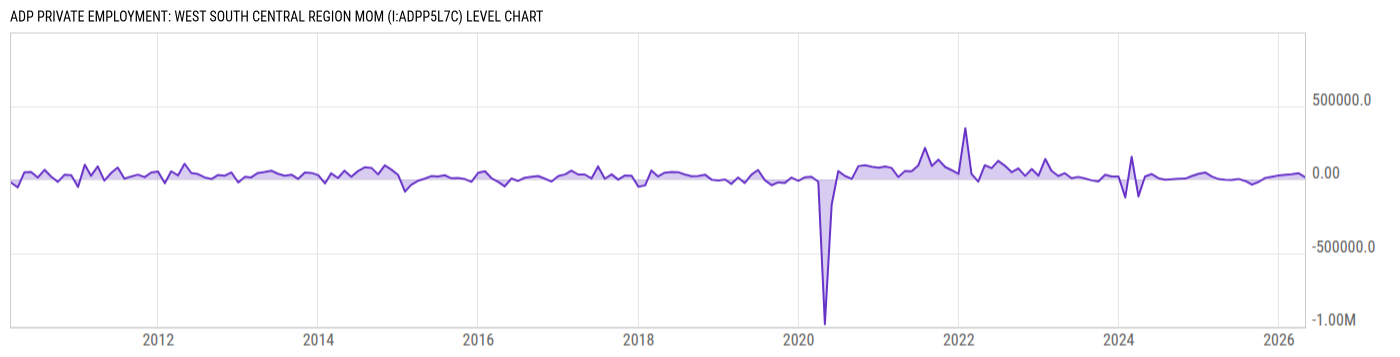
ADP Private Employment: West South Central Region MoM (I:ADPP5L7C)
16000.00 for Apr 2026
Level Chart
Basic Info
|
ADP Private Employment: West South Central Region MoM is at a current level of 16000.00, down from 43000.00 last month and up from -2000.00 one year ago. This is a change of -62.79% from last month. |
| Report | ADP National Employment Report |
| Categories | Employment , Hours and Wages |
| Region | United States |
| Source | ADP |
Stats
| Last Value | 16000.00 |
| Latest Period | Apr 2026 |
| Last Updated | May 8 2026, 10:55 EDT |
| Next Release | Jun 3 2026, 08:15 EDT |
| Average Growth Rate | 163.0% |
| Value from Last Month | 43000.00 |
| Change from Last Month | -62.79% |
| Value from 1 Year Ago | -2000.00 |
| Change from 1 Year Ago | N/A |
| Frequency | Monthly |
| Adjustment | Seasonally Adjusted |
| Download Source File |
Historical Data
| Date | Value |
|---|---|
| April 30, 2026 | 16000.00 |
| March 31, 2026 | 43000.00 |
| February 28, 2026 | 36000.00 |
| January 31, 2026 | 33000.00 |
| December 31, 2025 | 28000.00 |
| November 30, 2025 | 19000.00 |
| October 31, 2025 | 11000.00 |
| September 30, 2025 | -17000.00 |
| August 31, 2025 | -35000.00 |
| July 31, 2025 | -10000.00 |
| June 30, 2025 | 4000.00 |
| May 31, 2025 | -4000.00 |
| April 30, 2025 | -2000.00 |
| March 31, 2025 | 3000.00 |
| February 28, 2025 | 21000.00 |
| January 31, 2025 | 47000.00 |
| December 31, 2024 | 39000.00 |
| November 30, 2024 | 24000.00 |
| October 31, 2024 | 6000.00 |
| September 30, 2024 | 5000.00 |
| August 31, 2024 | 2000.00 |
| July 31, 2024 | -2000.00 |
| June 30, 2024 | 9000.00 |
| May 31, 2024 | 37000.00 |
| April 30, 2024 | 20000.00 |
| Date | Value |
|---|---|
| March 31, 2024 | -115000.0 |
| February 29, 2024 | 155000.0 |
| January 31, 2024 | -122000.0 |
| December 31, 2023 | 20000.00 |
| November 30, 2023 | 20000.00 |
| October 31, 2023 | 32000.00 |
| September 30, 2023 | -13000.00 |
| August 31, 2023 | -6000.00 |
| July 31, 2023 | 7000.00 |
| June 30, 2023 | 18000.00 |
| May 31, 2023 | 8000.00 |
| April 30, 2023 | 43000.00 |
| March 31, 2023 | 24000.00 |
| February 28, 2023 | 59000.00 |
| January 31, 2023 | 140000.0 |
| December 31, 2022 | 26000.00 |
| November 30, 2022 | 71000.00 |
| October 31, 2022 | 25000.00 |
| September 30, 2022 | 76000.00 |
| August 31, 2022 | 50000.00 |
| July 31, 2022 | 93000.00 |
| June 30, 2022 | 127000.0 |
| May 31, 2022 | 77000.00 |
| April 30, 2022 | 97000.00 |
| March 31, 2022 | -15000.00 |
News
Headline
Time (ET)
Wells Fargo Upgrades Automatic Data Processing to Equalweight From Underweight, Price Target is $214
05/18 05:24
05/05 07:58
04/30 09:57
Basic Info
|
ADP Private Employment: West South Central Region MoM is at a current level of 16000.00, down from 43000.00 last month and up from -2000.00 one year ago. This is a change of -62.79% from last month. |
| Report | ADP National Employment Report |
| Categories | Employment , Hours and Wages |
| Region | United States |
| Source | ADP |
Stats
| Last Value | 16000.00 |
| Latest Period | Apr 2026 |
| Last Updated | May 8 2026, 10:55 EDT |
| Next Release | Jun 3 2026, 08:15 EDT |
| Average Growth Rate | 163.0% |
| Value from Last Month | 43000.00 |
| Change from Last Month | -62.79% |
| Value from 1 Year Ago | -2000.00 |
| Change from 1 Year Ago | N/A |
| Frequency | Monthly |
| Adjustment | Seasonally Adjusted |
| Download Source File |