

ADP Private Employment: South Atlantic Region MoM (I:ADPPESSMC)
1000.00 for Apr 2026
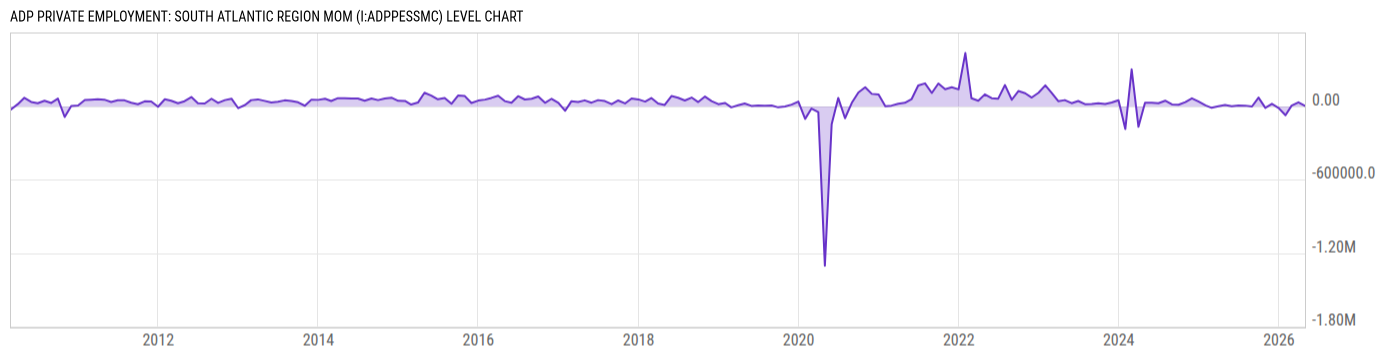
Level Chart
Basic Info
|
ADP Private Employment: South Atlantic Region MoM is at a current level of 1000.00, down from 30000.00 last month and down from 9000.00 one year ago. This is a change of -96.67% from last month and -88.89% from one year ago. |
| Report | ADP National Employment Report |
| Categories | Employment , Hours and Wages |
| Region | United States |
| Source | ADP |
Stats
| Last Value | 1000.00 |
| Latest Period | Apr 2026 |
| Last Updated | May 8 2026, 10:55 EDT |
| Next Release | Jun 3 2026, 08:15 EDT |
| Average Growth Rate | 190.0% |
| Value from Last Month | 30000.00 |
| Change from Last Month | -96.67% |
| Value from 1 Year Ago | 9000.00 |
| Change from 1 Year Ago | -88.89% |
| Frequency | Monthly |
| Adjustment | Seasonally Adjusted |
| Download Source File |
Historical Data
| Date | Value |
|---|---|
| April 30, 2026 | 1000.00 |
| March 31, 2026 | 30000.00 |
| February 28, 2026 | 3000.00 |
| January 31, 2026 | -75000.00 |
| December 31, 2025 | -17000.00 |
| November 30, 2025 | 18000.00 |
| October 31, 2025 | -15000.00 |
| September 30, 2025 | 68000.00 |
| August 31, 2025 | -4000.00 |
| July 31, 2025 | 3000.00 |
| June 30, 2025 | 4000.00 |
| May 31, 2025 | -2000.00 |
| April 30, 2025 | 9000.00 |
| March 31, 2025 | -2000.00 |
| February 28, 2025 | -15000.00 |
| January 31, 2025 | 5000.00 |
| December 31, 2024 | 36000.00 |
| November 30, 2024 | 63000.00 |
| October 31, 2024 | 32000.00 |
| September 30, 2024 | 10000.00 |
| August 31, 2024 | 13000.00 |
| July 31, 2024 | 43000.00 |
| June 30, 2024 | 22000.00 |
| May 31, 2024 | 27000.00 |
| April 30, 2024 | 27000.00 |
| Date | Value |
|---|---|
| March 31, 2024 | -170000.0 |
| February 29, 2024 | 299000.0 |
| January 31, 2024 | -188000.0 |
| December 31, 2023 | 47000.00 |
| November 30, 2023 | 28000.00 |
| October 31, 2023 | 17000.00 |
| September 30, 2023 | 23000.00 |
| August 31, 2023 | 16000.00 |
| July 31, 2023 | 15000.00 |
| June 30, 2023 | 41000.00 |
| May 31, 2023 | 23000.00 |
| April 30, 2023 | 48000.00 |
| March 31, 2023 | 39000.00 |
| February 28, 2023 | 109000.0 |
| January 31, 2023 | 168000.0 |
| December 31, 2022 | 108000.0 |
| November 30, 2022 | 69000.00 |
| October 31, 2022 | 104000.0 |
| September 30, 2022 | 122000.0 |
| August 31, 2022 | 51000.00 |
| July 31, 2022 | 171000.0 |
| June 30, 2022 | 60000.00 |
| May 31, 2022 | 64000.00 |
| April 30, 2022 | 95000.00 |
| March 31, 2022 | 43000.00 |
News
Headline
Time (ET)
Wells Fargo Upgrades Automatic Data Processing to Equalweight From Underweight, Price Target is $214
05/18 05:24
05/05 07:58
04/30 09:57
Basic Info
|
ADP Private Employment: South Atlantic Region MoM is at a current level of 1000.00, down from 30000.00 last month and down from 9000.00 one year ago. This is a change of -96.67% from last month and -88.89% from one year ago. |
| Report | ADP National Employment Report |
| Categories | Employment , Hours and Wages |
| Region | United States |
| Source | ADP |
Stats
| Last Value | 1000.00 |
| Latest Period | Apr 2026 |
| Last Updated | May 8 2026, 10:55 EDT |
| Next Release | Jun 3 2026, 08:15 EDT |
| Average Growth Rate | 190.0% |
| Value from Last Month | 30000.00 |
| Change from Last Month | -96.67% |
| Value from 1 Year Ago | 9000.00 |
| Change from 1 Year Ago | -88.89% |
| Frequency | Monthly |
| Adjustment | Seasonally Adjusted |
| Download Source File |