

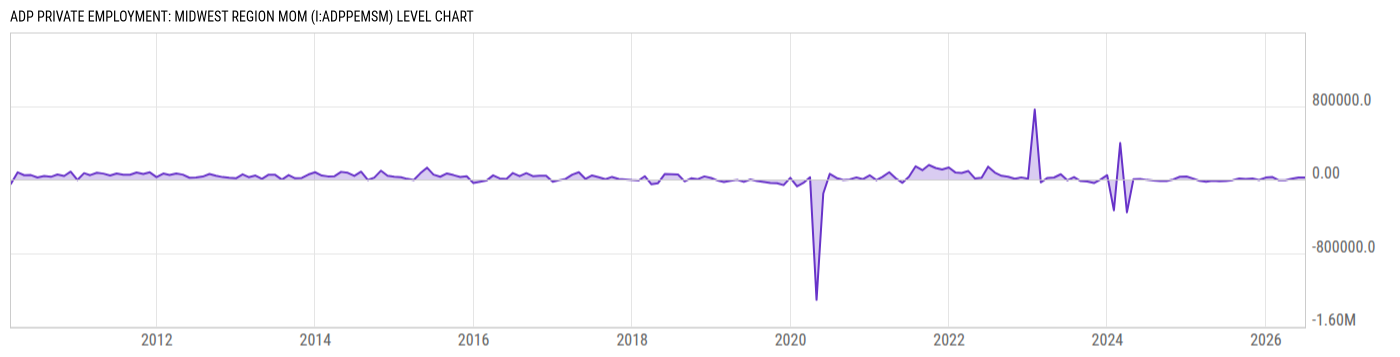
ADP Private Employment: Midwest Region MoM (I:ADPPEMSM)
21000.00 for Jun 2026
Level Chart
Basic Info
|
ADP Private Employment: Midwest Region MoM is at a current level of 21000.00, unchanged from 21000.00 last month and up from -17000.00 one year ago. This is a change of 0.00% from last month. |
| Report | ADP National Employment Report |
| Categories | Employment , Hours and Wages |
| Region | United States |
| Source | ADP |
Stats
| Last Value | 21000.00 |
| Latest Period | Jun 2026 |
| Last Updated | Jul 1 2026, 08:17 EDT |
| Average Growth Rate | -180.8% |
| Value from Last Month | 21000.00 |
| Change from Last Month | 0.00% |
| Value from 1 Year Ago | -17000.00 |
| Change from 1 Year Ago | N/A |
| Frequency | Monthly |
| Adjustment | Seasonally Adjusted |
| Formula | ADP Private Employment: East North Central Region MoM + ADP Private Employment: West North Central Region MoM |
Historical Data
| Date | Value |
|---|---|
| June 30, 2026 | 21000.00 |
| May 31, 2026 | 21000.00 |
| April 30, 2026 | 9000.00 |
| March 31, 2026 | -9000.00 |
| February 28, 2026 | -8000.00 |
| January 31, 2026 | 27000.00 |
| December 31, 2025 | 21000.00 |
| November 30, 2025 | -5000.00 |
| October 31, 2025 | 11000.00 |
| September 30, 2025 | 6000.00 |
| August 31, 2025 | 10000.00 |
| July 31, 2025 | -7000.00 |
| June 30, 2025 | -17000.00 |
| May 31, 2025 | -20000.00 |
| April 30, 2025 | -14000.00 |
| March 31, 2025 | -24000.00 |
| February 28, 2025 | -13000.00 |
| January 31, 2025 | 10000.00 |
| December 31, 2024 | 33000.00 |
| November 30, 2024 | 30000.00 |
| October 31, 2024 | 1000.00 |
| September 30, 2024 | -16000.00 |
| August 31, 2024 | -16000.00 |
| July 31, 2024 | -10000.00 |
| June 30, 2024 | -4000.00 |
| Date | Value |
|---|---|
| May 31, 2024 | 5000.00 |
| April 30, 2024 | 4000.00 |
| March 31, 2024 | -357000.0 |
| February 29, 2024 | 397000.0 |
| January 31, 2024 | -336000.0 |
| December 31, 2023 | 47000.00 |
| November 30, 2023 | -2000.00 |
| October 31, 2023 | -39000.00 |
| September 30, 2023 | -22000.00 |
| August 31, 2023 | -17000.00 |
| July 31, 2023 | 26000.00 |
| June 30, 2023 | -9000.00 |
| May 31, 2023 | 57000.00 |
| April 30, 2023 | 22000.00 |
| March 31, 2023 | 17000.00 |
| February 28, 2023 | -31000.00 |
| January 31, 2023 | 761000.0 |
| December 31, 2022 | 8000.00 |
| November 30, 2022 | 23000.00 |
| October 31, 2022 | 8000.00 |
| September 30, 2022 | 30000.00 |
| August 31, 2022 | 40000.00 |
| July 31, 2022 | 75000.00 |
| June 30, 2022 | 140000.0 |
| May 31, 2022 | 19000.00 |
News
Headline
Time (ET)
07/22 10:17
07/10 08:58
07/02 16:13
Basic Info
|
ADP Private Employment: Midwest Region MoM is at a current level of 21000.00, unchanged from 21000.00 last month and up from -17000.00 one year ago. This is a change of 0.00% from last month. |
| Report | ADP National Employment Report |
| Categories | Employment , Hours and Wages |
| Region | United States |
| Source | ADP |
Stats
| Last Value | 21000.00 |
| Latest Period | Jun 2026 |
| Last Updated | Jul 1 2026, 08:17 EDT |
| Average Growth Rate | -180.8% |
| Value from Last Month | 21000.00 |
| Change from Last Month | 0.00% |
| Value from 1 Year Ago | -17000.00 |
| Change from 1 Year Ago | N/A |
| Frequency | Monthly |
| Adjustment | Seasonally Adjusted |
| Formula | ADP Private Employment: East North Central Region MoM + ADP Private Employment: West North Central Region MoM |